
- Title
-
Zebrafish Blunt-Force TBI Induces Heterogenous Injury Pathologies That Mimic Human TBI and Responds with Sonic Hedgehog-Dependent Cell Proliferation across the Neuroaxis
- Authors
- Hentig, J., Cloghessy, K., Lahne, M., Jung, Y.J., Petersen, R.A., Morris, A.C., Hyde, D.R.
- Source
- Full text @ Biomedicines

A reproducible and scalable blunt-force TBI in adult zebrafish. (A) Diagram depicting the conditions of the modified Marmarou weight drop scaled to the adult zebrafish. On the left, the tube through which the dropping ball falls is shown relative to the head and brain of the zebrafish. On the right, a red circle over the brain diagram shows the relative impact center of the dropping ball (forebrain in green, midbrain in purple, and hindbrain in blue). (B) Following damage, the percentage of fish dying significantly increased relative to the damage severity (n ≥ 200 fish). (C) Graph of the percentage of fish surviving following TBI out to 28 dpi. All mortality took place within 1 dpi (n = 30). (D) The recovery time for the fish to right themselves without exhibiting akinesia, ataxia, and motor incoordination significantly increased with damage severity (n = 15). (E) The percentage of fish that experienced intense tonic-clonic seizures significantly increased relative to the damage severity (n ≥ 200 fish). (F) The percentage of fish exhibiting post-traumatic seizures observed out to 28 dpi significantly increased relative to the damage severity. No seizures were observed after 1.5 dpi for any of the damage severities (n = 30). Forebrain, FB, hind-brain, HB, midbrain, MB All graph data points are Mean ± SEM. Statistical analyses were performed with either Two-way ANOVA or One-way ANOVA followed by a Tukey post-hoc test. ## p < 0.01. |

MMWD produces graded hematomas and blood–brain barrier disruption. (A) Isolated, undamaged whole brain with the major lobes labeled. Dorsal views of roya9;mitfaw2 (casper) undamaged (B) and TBI fish displaying vascular injury 4 hpi (C–E). Compared to undamaged controls, vascular injury resulted in hemorrhaging (arrowheads) in all severity levels that increased in a severity-dependent manner. (F) Coronal section of sTBI brain with intracerebral hematoma (red boundary). (G–M) Repeated dorsal view of an individual sTBI albinob4 fish across time, in which hemorrhaging (arrowheads) qualitatively peaked at 12 hpi, and gradually resolved by 3 dpi. (N) Following injury, a significant increase in solubilized Evans Blue dye represented disruption of the BBB in a severity-dependent manner. (O) Following sTBI, a statistically significant increase in solubilized Evans Blue dye occurred by 2 hpi and then gradually decreased until it reached control levels at 3 dpi (3 pooled brains/group, n = 2–3 groups). (P–U) Dorsal, ventral, and coronal views of isolated undamaged (P,Q,R) and sTBI brains at 2 hpi (S,T,U) from fish injected with Evans Blue dye as a qualitative measure of BBB integrity. Solid lines in (F,R,U) denote tissue boundaries, while dotted lines denote internal anatomical boundaries. Corpus cerebelli, CCe, hypothalamus, Ht, medial valvula cerebelli, Vam, medulla oblongata, MO, medulla spinalis, MS, olfactory bulb, OB, optic tectum, TeO, periventricular grey zone, PGZ, tectal ventrical, TeV, telencephalon, Tel, torus longitudinalis, TL, ventral optic tectum, VTeO, ventral telencephalon, VTel. Scale bars, (A–E,G–M,P–T) = 500 µm, (F,R–U) = 250 µm. Mean ± SEM is depicted in (N,O). Statistical analyses were performed with a One-way ANOVA followed by a Tukey post-hoc test. ## p < 0.01. |
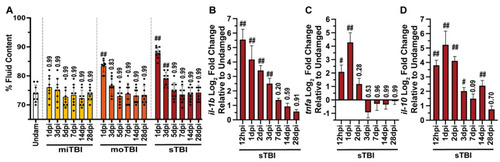
TBI inflicted zebrafish display edema and neuroinflammation. (A) Graph of level of edema, measured as the percentage of fluid in the brain, at all severities from 1–28 dpi, in which edema increased in a severity-dependent fashion, and remained elevated until 3 dpi and 5 dpi for moTBI and sTBI, respectively (n = 9). (B,C) Expression of pro-inflammatory cytokine genes il-1b (B) and tnfa (C) were significantly elevated in sTBI for 3 or 1 dpi, respectively, following injury before returning to near undamaged levels (5 pooled cerebellums/group, n = 3 groups). (D) Anti-inflammatory cytokine il-10 gene expression was also elevated and remained highly upregulated for 14 dpi (5 pooled cerebellums/group, n = 3 groups). Mean ± SEM is depicted in all graphs. Statistical analyses were performed with a One-way ANOVA followed by a Tukey’s or Dunnett’s multiple comparison post-hoc test. # p < 0.05, ## p < 0.01. |
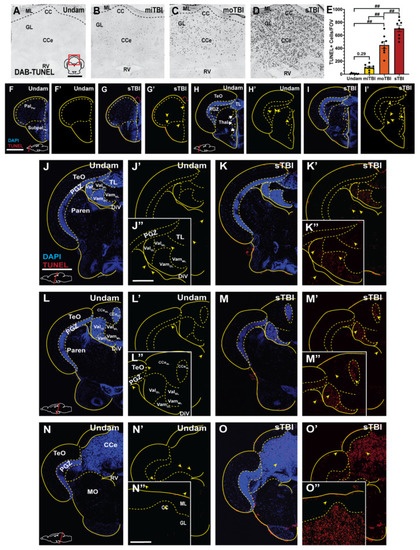
Cell death is severity-dependent and radiates out from the impact zone as a gradient. (A–D) Brightfield images of coronal cerebellar (CCe) sections stained with DAB-TUNEL 16 hpi. Prominent DAB TUNEL-positive cells were observed in the CCe in a severity-dependent manner. (E) Quantification of the number of DAB-TUNEL-positive cells/section revealed significant increases in the number of TUNEL-positive cerebellar cells following moTBI and sTBI (n = 8). (F–O”) Confocal images of coronal sections, from rostral to caudal across the neuroaxis, stained with fluorescent TUNEL and DAPI-labeled at 16 hpi (J–O). Apoptotic cell death, emanating from the impact zone, was observed widely across the neuroaxis. The red box in panel A shows the relative position of the image on the appropriate brain cross-section. Solid lines denote tissue boundaries, while dotted lines denote internal anatomic boundaries. Cerebellar crest, CC, corpus cerebelli, CCe, diencephalic ventricle, DiV, granule cell layer, GL, molecular layer, ML, medulla oblongata, MO, parenchyma, Paren, periventricular grey zone, PGZ, optic tectum, TeO, torus longitudinalis, TL, rhombencephalic ventricle, RV, medial valvula cerebelli, Vam, lateral valvula cerebelli, Val. Scale bars: (A) = 100 µm, for panels (A–D,F) = 200 µm, for panels (F–I’,J) = 500 µm, for panels (J–O’,J”) = 200 µm, for panels (J”–M”,N”) = 100 µm, for panels (N”,O”). Mean ± SEM is depicted in (E). Statistical analyses were performed with a One-way ANOVA followed by a Tukey’s post-hoc test. ## p < 0.01. |

Apoptotic cell-death in cerebellar neurons. (A–B’’’) Confocal images of coronal cerebellar sections stained with pan-neuronal marker HuCD (gray), fluorescent TUNEL (red), and DAPI (DAPI) at 16 h follow a sTBI. Apoptotic cell death was observed in the epicenter of the impact zone, in the densely packed granule layer of the cerebellum. (C–E’’’’) High magnification confocal images revealed colabelling of HuCD, TUNEL, and DAPI. The white box in panels (A–A’’’) represent the region that is shown in corresponding panels (B–B’’’). Lettered white boxes in panels (B–B’’’) denote subsequent panels at higher magnification. A solid line denotes tissue boarder, dotted line denotes boarder between molecular and granule layer of the CCe. Cerebellar crest, CC, granule cell layer, GL, molecular layer, ML. Scale bars, (A) = 100 µm, for panels (A–A’’’,B) = 50 µm, for panels (B–B’’’,C) = 15 µm, for panels (C–E’’’’). |

Injury-induced sensorimotor and cognitive deficits are severity-dependent with rapid recovery. (A) Sensorimotor coordination (plotted as a sum of four independent sensorimotor features involving swimming orientation and adverse tactile stimulus, Table 1) was significantly impaired following sTBI for up to 12 hpi compared to the pre-injury response (n = 10). (B) The unprovoked swim velocity over time was not significantly different between undamaged controls and all three severity models from 4 hpi to 28 dpi (n = 15). (C) Quantification of the swim distance of undamaged and sTBI fish following the startle response across iterations 1, 5, and 10 at 1, 4, and 7 dpi. TBI-damaged fish displayed cognitive deficits in this non-associative learning assay (n = 9). (D) Quantification of associative learning, using the shuttle box assay, of undamaged fish and all TBI severities from 1–28 dpi measuring the number of trials to master the assay (n = 12). All three damage severities resulted in a significant reduction in learning that returned to normal between 4–7 dpi. (E) Quantification of immediate- and delayed-recall of associative learning of undamaged and all three TBI severities using the shuttle box assay. All three TBI categories (miTBI, moTBI, sTBI) resulted in both learning and recall deficits (n = 9). Mean ± SEM is depicted in (A–C,E), while standard deviation is shown in (D). Statistical analyses were performed with either Two-way ANOVA, or a One-way ANOVA followed by a Tukey’s or Dunnett’s multiple comparison post-hoc test. # p < 0.05, ## p < 0.01. |
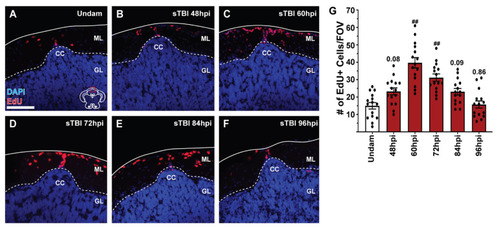
Blunt-force TBI induces cell proliferation at the cerebellar crest. (A–F) Confocal images of coronal cerebellar sections of undamaged and sTBI fish that were IP-injected with EdU 12 h prior to collection. EdU-labelled cells (red) are present radiating from the cerebellar crest in all panels. (G) Quantification of the number of EdU-positive cells at the CC at various timepoints following sTBI (n = 15). Increased EdU labeling, relative to undamaged fish, was observed as early as 48 hpi, with peak proliferation at 60 hpi. Solid lines in (A–F) denote tissue boundary, while dotted lines denote internal anatomical boundaries. Cerebellar crest, CC, granule cell layer, GL, molecular layer, ML. Scale bar = 100 µm for (A–F). Mean ± SEM is depicted in (G). Statistical analysis was performed using a One-way ANOVA followed by a Tukey’s post-hoc test. # p < 0.05, ## p < 0.01. |

Blunt-force TBI results in increased proliferation in the brain. ( |
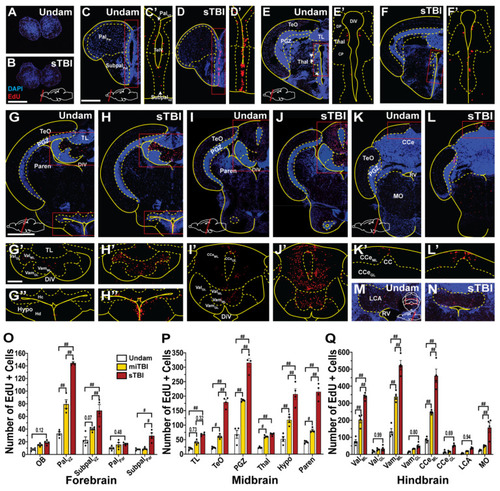
Injury-induced proliferation across the neuroaxis is region-specific and severity-dependent. (A–N) Coronal brain sections of undamaged and sTBI fish from the rostral aspect of the olfactory bulb to the caudal aspect of the lobus caudalis cerebelli. Red boxed regions in (C–L) are shown across the midline at a higher magnification in the corresponding prime and double prime panels. (O–Q) Quantification of the number of EdU-positive cells in brain subregions in undamaged, miTBI, and sTBI fish (n = 4). Solid lines in (A–N) denote tissue boundary, while dotted lines denote internal anatomical boundaries. Central posterior thalamic region, CP, corpus cerebelli, CCe, granule cell layer of corpus cerebelli, CCeGL, molecular layer of corpus cerebelli, CCeML, diencephalic ventricle, DiV, dorsal posterior thalamic region, DP, lobus caudalis cerebelli, LCA, medulla oblongata, MO, olfactory bulbs, OB, parenchyma of pallium, PalPar, ventricular/subventricular zone of pallium, PalVZ, parenchyma of midbrain, Paren, periventricular grey zone of tectum optic, PGZ, rhombencephalic ventricle, RV, telencephalic ventricle, TeV, optic tectum, TeO, thalamus, Thal, torus longitudinalis, TL, parenchyma of subpallium, SubpalPar, ventricular/subventricular zone of subpallium, SubpalVZ, granule cell layer of lateral valvula cerebelli, ValGL, molecular layer of lateral valvula cerebelli, ValML, granule cell layer of medial valvula cerebelli, VamGL, molecular layer of medial valvula cerebelli, VamML. Scale bars: (B) = 100 µm, for panels (A–C) = 200 µm, for panels (C–F’,G) = 500 µm, for panels (G–L,G’) = 200 µm, for panels (G’–L’,M,N). Mean ± SEM is depicted in (O–Q). Statistical analyses were performed with a Two-way ANOVA followed by a Sidik’s multiple comparison test. # p < 0.05, ## p < 0.01. |

Blunt-force TBI induces cell proliferation, migration, and differentiation in the cerebellum. (A–E’) Coronal cerebellar sections of sTBI fish (A’–E’) that were IP-injected with EdU at 48 hpi and collected 51, 60, 72, 84, and 96 hpi to identify the migration pattern of injury-induced proliferative cells. Control undamaged fish (A–E) were also injected and brains assessed at similar intervals as sTBI fish. Coronal cerebellar sections of undamaged (F) and sTBI (G) Tg[nestin:GFP] fish with high magnification insets (F’–F’’,G’–G”) that were IP-injected with EdU 12 h prior to collection at 60 hpi with colabeling of EdU and Tg[nestin:GFP] (yellow arrowheads). Coronal cerebellar sections of undamaged (H–H’’,J–J’’) and sTBI fish (I–I’’,K–K’’) that were IP-injected with EdU at 48 and 60 hpi to capture early onset and peak proliferative events and collected at either 7 (H–I’’) or 30 dpi (J–K’’) and costained with HuCD. (L) Quantification of the number of EdU-positive, nestin:GFP-positive, or colabeled cells for experiments in representative images (F–G”) (n = 10). (M) Quantification of the number of EdU/HuCD colabeled cells for experiments in representative images (H–K”) (n = 15). Solid lines in (A–K”) denote tissue boundary, while dotted lines denote internal anatomical boundaries. Cerebellar crest, CC, granule cell layer, GL, molecular layer, ML. All scale bars = 100 µm. Mean ± SEM is depicted in L and M. Statistical analyses were performed with either a One-way ANOVA or Two-way ANOVA followed by a Tukey’s post-hoc test. ## p < 0.01. |

Shh regulates cerebellar proliferation and differentiation following injury. (A) Expression of Shh pathway genes by qRT-PCR reveals that the shha and shhb mRNAs are upregulated by 4 hpi in the top 1/3rd of the cerebellum, while gli and smo expression increased by 12 hpi (5 pooled cerebellums/group, n = 3 groups). (B–G) Coronal cerebellar sections of the CC of undamaged (B–D) and sTBI fish (E–G) that were IP-injected with EdU and either vehicle (C,F), the Smo agonist purmorphamine (D), or the Smo antagonist cyclopamine (G). (H,H”–I,I”) Coronal cerebellar sections of undamaged fish that were either untreated (H–H’’) or purmorphamine-treated (I–I’’) that were IP-injected with EdU and collected at 7 dpi. Coronal cerebellar sections of sTBI fish that were either untreated (J–J’’) or cyclopamine-treated (K–K’’) that were IP-injected with EdU and collected at 7 dpi. (L) Quantification of the number of EdU-positive cells at the CC in undamaged and sTBI fish with Shh modulation (n = 9). (M,N) Quantification of the number of EdU/HuCD double-positive cells in the granule cell layer of the cerebellum in undamaged and sTBI fish with Shh modulation (n = 10). Solid lines in (B–K”) denote tissue boundary, while dotted lines denote internal anatomical boundaries. Cerebellar crest, CC, granule cell layer, GL, molecular layer, ML. All scale bars = 100 µm. Mean ± SEM is depicted in (L–N). Statistical analyses were performed with either a One-way ANOVA or Two-way ANOVA followed by a Tukey’s post-hoc test. ## p < 0.01. |