
- Title
-
Irf2bp2a regulates terminal granulopoiesis through proteasomal degradation of Gfi1aa in zebrafish
- Authors
- Gao, S., Wang, Z., Wang, L., Wang, H., Yuan, H., Liu, X., Chen, S., Chen, Z., de Thé, H., Zhang, W., Zhang, Y., Zhu, J., Zhou, J.
- Source
- Full text @ PLoS Genet.
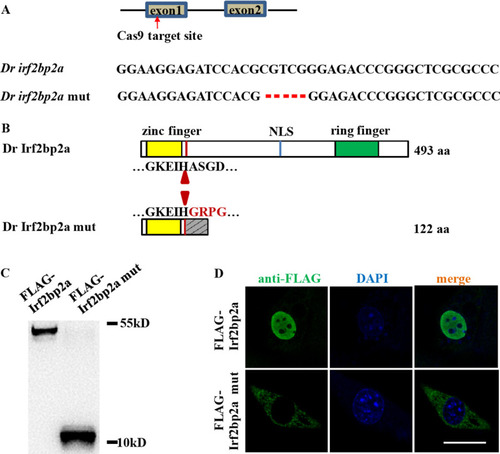
(A) Schematic representation of Cas9 target site in the first exon of zebrafish |
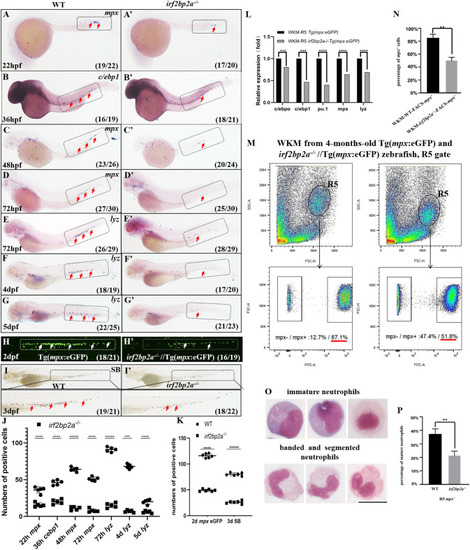
(A-G’) WISH analyses of neutrophils markers |

(A) Structure, missing function and rescue effect of wild type and variant forms of Irf2bp2a. (B-J) |
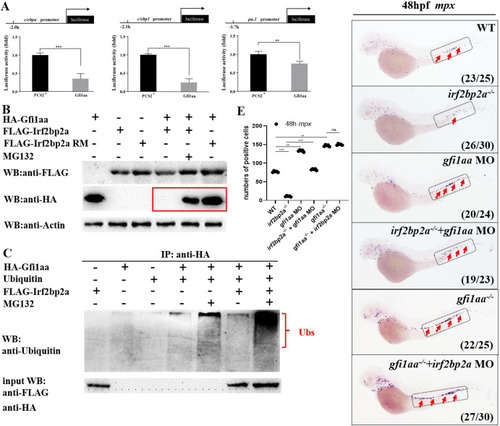
(A) Luciferase reporter assay. Bars showed the relative luciferase activity on the zebrafish |

(A) Luciferase reporter assay. Bars showed the relative luciferase activity on the zebrafish |