FIGURE SUMMARY
Title

Identification and Tissue-Specific Characterization of Novel SHOX-Regulated Genes in Zebrafish Highlights SOX Family Members Among Other Genes

Authors
Hoffmann, S., Roeth, R., Diebold, S., Gogel, J., Hassel, D., Just, S., Rappold, G.A.
Source
Full text @ Front Genet

ZFIN is incorporating published figure images and captions as part of an ongoing project. Figures from some publications have not yet been curated, or are not available for display because of copyright restrictions.

ZFIN is incorporating published figure images and captions as part of an ongoing project. Figures from some publications have not yet been curated, or are not available for display because of copyright restrictions.

ZFIN is incorporating published figure images and captions as part of an ongoing project. Figures from some publications have not yet been curated, or are not available for display because of copyright restrictions.

ZFIN is incorporating published figure images and captions as part of an ongoing project. Figures from some publications have not yet been curated, or are not available for display because of copyright restrictions.

ZFIN is incorporating published figure images and captions as part of an ongoing project. Figures from some publications have not yet been curated, or are not available for display because of copyright restrictions.

Microarray analysis of SHOX overexpressing wild type (WT) and mutant (HM) normal human dermal fibroblast (NHDF) cells. (A) Overview of experimental design. (B) Top 10 regulated genes in SHOX overexpressing NHDF cells after 6, 12, and 24 h. Identical colors indicate the same genes at different time points. Relative expression ratios are indicated next to the gene’s name.

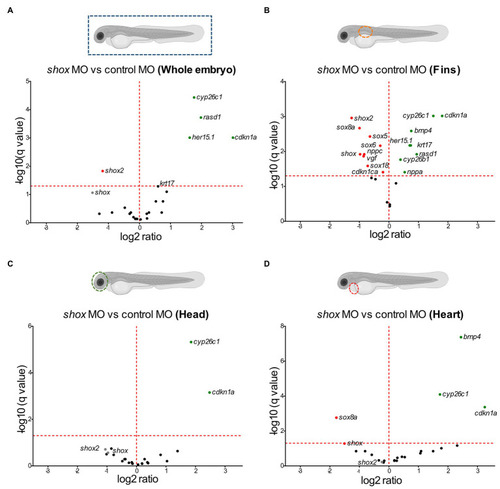
Tissue-specific validation of putative Shox target genes in zebrafish embryos after shox knockdown. Volcano plot presentations of expression ratio of selected shox target genes in (A) whole zebrafish tissue (n = 6 shox MO, n = 6 control MO), (B) fins (n = 3 shox MO, n = 3 control MO), (C) head (n = 4 shox MO, n = 4 control MO), and (D) heart (n = 4 shox MO, n = 5 control MO) at 55 hours post-fertilization (hpf) after morpholino-mediated knockdown of shox compared to controls. Genes above the red horizontal dashed line are significantly regulated. Genes shown to the left of the dashed vertical line are downregulated, those on the right are upregulated. Statistical significance was determined by multiple unpaired t-tests adjusted by the two-stage step-up method of Benjamini, Krieger, and Yekutieli (adjusted values of p = q-values). MO, morpholino.

Validation of putative Shox target genes in zebrafish fins. Tissue-specific analysis of all selected shox targets upon morpholino-mediated shox knockdown in zebrafish fins 55 hpf (orange) compared to controls (gray); n = 3 experiments per condition. Significantly regulated genes are highlighted. For ARC, no Zebrafish otholog exists. HES5 corresponds to her15.1 in zebrafish. Statistical significance was determined by multiple unpaired t-tests adjusted by the two-stage step-up method of Benjamini, Krieger, and Yekutieli (adjusted values of p are indicated by *p < 0.05; **p < 0.01; and ***p < 0.001). MO, morpholino; hpf, hours post-fertilization.

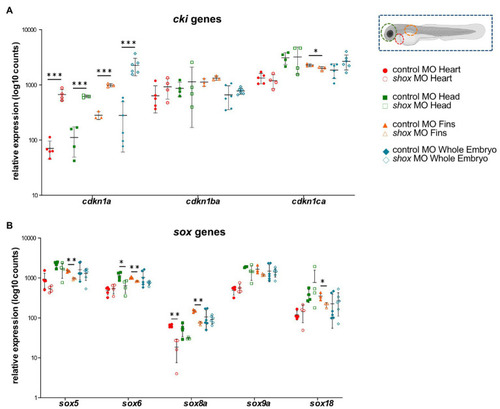
Tissue-specific analysis of gene families upon morpholino-mediated shox knockdown in zebrafish embryos 55 hpf compared to controls. Relative expression levels for (A) the cyclin-dependent kinase inhibitor (cki) family members cdkn1a, cdkn1ba, and cdkn1ca; (B) members of the SRY-related HMG-box (sox) genes sox5, sox6, sox8a, sox9a, and sox18 in heart (red; n = 4–5), head (green; n = 4), fin (orange; n = 3) or whole embryo (blue; n = 6). Statistical significance was determined by multiple unpaired t-tests adjusted by the two-stage step-up method of Benjamini, Krieger, and Yekutieli (adjusted values of p are indicated as *p < 0.05, **p < 0.01, and ***p < 0.001). MO, morpholino.

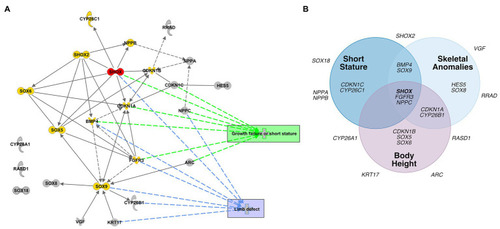
Database analyses of SHOX-regulated genes. (A) Network-based pathway analysis of SHOX-regulated genes using the Ingenuity pathway analysis (IPA) software. SHOX is highlighted in red. Known SHOX-associated genes are shown in yellow. Novel SHOX-regulated genes are shown in gray. Direct regulations are indicated by arrows and interactions as lines; indirect regulations or interactions are presented as dotted arrows/lines, respectively. The most important annotated pathways relevant to SHOX-associated diseases or function are highlighted in green (genes involved in growth failure and short stature) and blue (genes involved in limb defects). (B) Gene-disease association according to DisGeNET. Venn diagram showing associations between SHOX and 23 SHOX-regulated genes with respect to skeletal phenotypes based on the DisGeNET database (https://www.disgenet.org/home/; Pinero et al., 2015).

Acknowledgments
This image is the copyrighted work of the attributed author or publisher, and ZFIN has permission only to display this image to its users. Additional permissions should be obtained from the applicable author or publisher of the image. Full text @ Front Genet