
- Title
-
Generation of GCaMP6s-Expressing Zebrafish to Monitor Spatiotemporal Dynamics of Calcium Signaling Elicited by Heat Stress
- Authors
- Li, F., Long, Y., Xie, J., Ren, J., Zhou, T., Song, G., Li, Q., Cui, Z.
- Source
- Full text @ Int. J. Mol. Sci.

Generation of Tg[Cca.actb:GCaMP6s](ihb371Tg) transgenic zebrafish. (A) Schematic of the pTol2-Cca.actb-GCaMP6s construct. ITR-L and ITR-R, left and right inverted terminal repeats of Tol2 transposon; Cca.actb promoter, promoter of the common carp β-actin (actb) gene. Directions of the arrows and arrow heads are the same as the transgenic elements they represented. The transgenic elements were shown in different color for clear discrimination. (B) PCR screen of positive P0 individuals. M: DNA marker; 1 to 12: fish number. (C) Transgene copy number of the positive F1 individuals detected by qPCR assay. The x-axis represents fish number. (D) Southern blotting confirmed a single copy of the transgene in the genome of F1 transgenic zebrafish. The genomic DNA was digested by XcmI and HindIII, respectively. (E) Cloning flanking sequences of the transgene through genome walking. L1 to L3: products of the first to third round of PCR reactions using primers located on ITR-L; R1 and R2: products of the first and second round of PCR reactions using primers located on ITR-R. (F) Schematic of the integration site of the transgene in zebrafish genome. The insertion site is 88 kb downstream of the mamdc2b gene and 16 kb upstream of the apba1b gene on chromosome 10. The arrows indicate primers used for genotyping. (G) Genotyping of the transgenic zebrafish. PCR assays using primer pairs amplifying both ends of the transposon demonstrate the integrity of transgene cassette. This transgenic fish line was submitted to the China Zebrafish Resource Center (CZRC) under the accession number ihb371. |
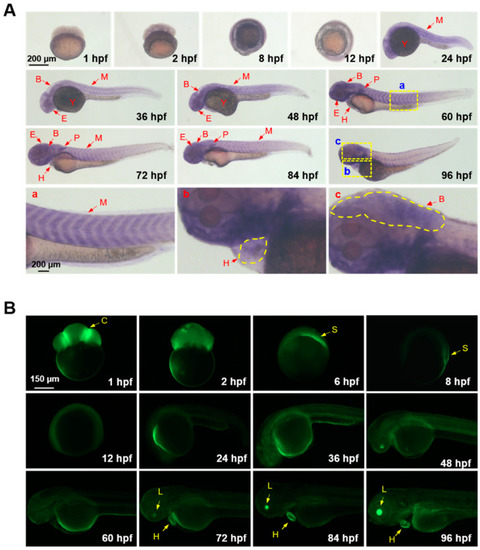
GCaMP6s expression and Ca2+ signaling activity in embryos and larvae of the transgenic zebrafish. (A) Spatiotemporal expression patterns of GCaMP6s analyzed by whole-mount in situ hybridization. The magnified images indicate the expression of GCaMP6s in the myotome (a), heart (b) and brain (c). (B) Fluorescent microscope images indicating Ca2+ signaling activities in the anatomical structures of zebrafish embryos and larvae. Lateral view of the early embryos (before 12 hpf) are shown. The embryos and larvae after 24 hpf were oriented as head to the left and dorsal to the top. B, brain; C, cleavage furrow; E, eyes; H, heart; L, lens; M, myotome; P, pectoral fin; S, embryonic shield; Y, yolk sac. |

Workflow of the protocol to analyze in vivo activities of Ca2+ signaling triggered by heat stress. Low melting-point (LMP) agarose was melted and poured into a confocal dish. After solidification of the LMP agarose, a tiny pit was made in the middle of the agarose plane. A larva anesthetized with MS-222 was put into the pit. The dish was placed onto the stage of a confocal microscope and orientation of the larvae was adjusted. After that, Z-stack time-lapse imaging was initiated immediately upon addition of hot water into the dish. Taking into account strong basal fluorescence of the eyes and the heart, these organs were shaded before measuring fluorescence intensity. Finally, the time-lapse fluorescence intensity data were plotted to illustrate the dynamics of Ca2+ signaling elicited by heat stress. |
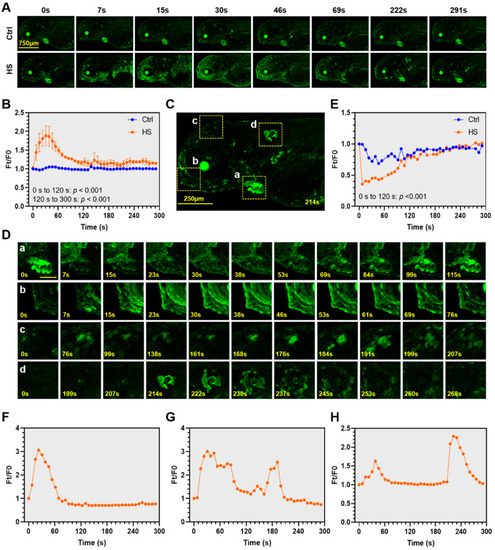
Spatiotemporal dynamics of the heat-elicited Ca2+ signaling in zebrafish larvae. (A) Representative time-lapse confocal microscope images illustrating dynamics of the heat-elicited Ca2+ signaling. E3 medium preconditioned at 28 °C was added to the control (Ctrl), while heat shock (HS) was exerted by adding E3 medium at 40 °C. The time points at which the images were taken are shown above the corresponding images. (B) Overall GCaMP6s fluorescence dynamics upon heat stress. The y-axis indicates the ratio of fluorescence intensity at different time points (Ft) to that before heat shock (F0). The x-axis indicates time duration under heat stress. Data are shown as mean ± standard error (n = 3). (C) A magnified image indicates the organs and regions (enclosed by dashed rectangles) demonstrating marked changes in GCaMP6s fluorescence upon heat stress. (a), heart; (b), region around the mouth protruding; (c), region above the eye; (d), a neuromast-like structure. (D) Magnified images of the organs and regions marked in (B). The scale bar represents 200 μm. (E) Exposure to heat stress transiently decreased intracellular Ca2+ concentration in the heart of zebrafish larvae. (F–H) Line charts demonstrating fluorescence dynamics of the representative anatomical structures shown in (Cb–d). (F) Region around mouth protruding (Cb). (G) Region above the eye (Cc). (H) A neuromast-like structure (Cd). The measurements were repeated at least three times and representative results are shown. |

Effects of combining lanthanum chloride (LaCl3) and capsazepine on the heat-elicited Ca2+ events. (A) Fluorescence images of the transgenic zebrafish larvae pretreated with LaCl3 and capsazepine and exposed to heat stress. The larvae were pretreated with 0.2 mM LaCl3 (HS + LaCl3), 5 μM capsazepine (HS + Cap) or both (HS + LaCl3+ Cap). The controls were not treated with the inhibitors (HS). (B–D) Line charts indicating effects of the inhibitors on heat-induced increase of Ca2+ concentration. (B) LaCl3, (C) Capsazepine, (D) LaCl3 + capsazepine. Data are shown as mean ± standard error (n = 3). |
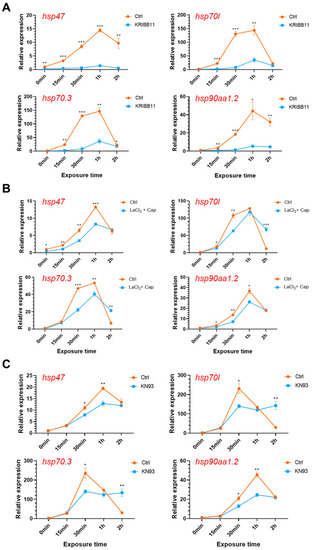
Effects of modulating the Ca2+-CaMKII-HSF1 pathway on expression of the hsp genes. Zebrafish larvae at 96 hpf were treated with the specific inhibitors for HSF1 (A, 10 μM KRIBB11), membrane calcium channels (B, 0.2 mM LaCl3 plus 5 μM capsazepine) and CaMKII (C, 10 μM KN93 phosphate) before and upon exposure to 34 °C heat stress for indicated times. Data are shown as mean ± standard error (n = 3). *, p < 0.05; **, p < 0.01; ***, p < 0.001. |