
- Title
-
Identification of in vivo Hox13-binding sites reveals an essential locus controlling zebrafish brachyury expression
- Authors
- Ye, Z., Braden, C.R., Wills, A., Kimelman, D.
- Source
- Full text @ Development
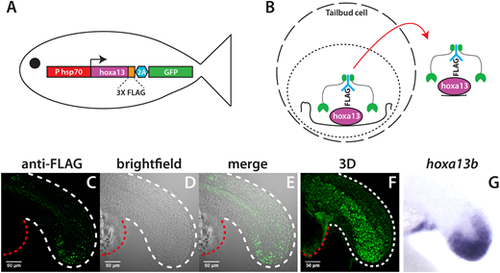
Identification of in vivo Hoxa13b targets with CUT&RUN. (A) Schematic of the HS:hoxa13b-FLAG-GFP transgenic line. (B) CUT&RUN procedure. Cells isolated from dissected tailbuds are separated and permeabilized. First, an antibody is added (in this case anti-FLAG), then a Protein A/G-Micrococcal nuclease (green), which cuts the genomic DNA locally, allowing transcription factor-DNA complexes to exit the cell, whereupon they are isolated and analyzed by DNA sequencing. (C-F) Expression of Hoxa13b-FLAG in KI:hoxa13b-FLAG-GFP embryos as detected with an anti-FLAG antibody in a 20-somite stage embryo. Shown are the lateral view of a middle slice of the tail (C-E) and an image from the 3D reconstruction (F). The white dashed line shows the posterior body border and the red dashed line shows the yolk extension. See also Movie 1 for a 360° view of the tail. (G) In situ hybridization showing hoxa13b transcripts in the tailbud of a 20-somite stage WT embryo for comparison. |

Quality assessment of CUT&RUN. (A,B) CUT&RUN fragment size distribution. Plots showing the proportion of DNA for each fragment size (A) and raw number of fragments by size (B). Both biological replicates (rep) are shown in A and B. The histone mark samples show strong enrichment of mononucleosome-sized fragments, whereas the control samples show a random size distribution. (C) Assessment of replicate reproducibility. The genome was subdivided into 500 bp bins; the reads for each sample in each bin were assessed and then subjected to correlation analysis between the samples. The high correlation between the replicates of the histone modification samples shows the reproducibility of the CUT&RUN experiment. The activating modifications (H3K27ac and H3K4me1) were generally well correlated. (D-H) Heatmaps (bottom) and plots (top) showing the signal within ±1 kb of the CUT&RUN peak summit center for both the experimental (Exp) and control samples. (I) comparison of CUT&RUN results (light green and dark green tracks) to previous ChIP-Seq data (blue tracks) for two posteriorly expressed genes, sox2 and cdx4. |
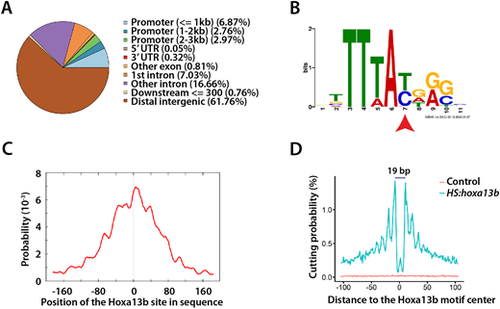
Hoxa13b-binding sites and motif analysis. (A) Distribution of the Hoxa13b target sites in the genome. Most sites are in distal intergenic regions. (B) The Hoxa13b-binding motif discovered from analysis of the CUT&RUN data. The red arrowhead indicates a base that, as a T, is bound by all Hox proteins, whereas, as a C, it is bound by posterior Hox proteins, based on in vitro studies. (C) The Hoxa13b motif shown in B is centrally located among all the CUT&RUN DNA fragments that contain a Hox motif, as expected. (D) Hoxa13b forms a 19 bp footprint at the Hoxa13b motif sites in the HS:hoxa13b-FLAG-GFP sample (teal), whereas, in the control sample, DNA cutting by MNase was random and rare at the same sites (red). |

Hox elements upstream of the tbxta transcriptional start site. (A) IGV tracks showing the two Hoxa13b-binding elements discovered using CUT&RUN. A peak appears at the Hox element 1 site in both the HS:hoxa13b-FLAG-GFP and KI:hoxa13b-FLAG-GFP lines, whereas a weaker signal exists at the Hox element 2 site in the HS:hoxa13b-FLAG-GFP sample but not in the KI:hoxa13b-FLAG-GFP sample. Both elements have peaks for H3K4me1 and H3K27ac. (B) The alignment of Hox element 1 in a variety of species is shown, including consensus sites for Hox, Rbpj and Tcf7/Lef1 binding. In all species, there is a C in the Hox site at the nucleotide position specifically recognized by posterior Hox proteins (arrowhead). |
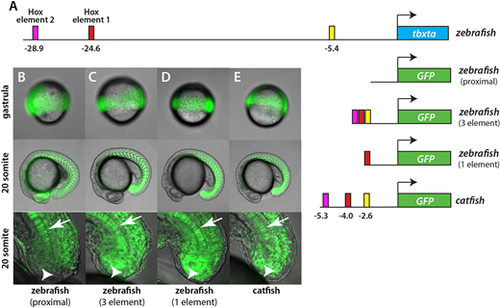
Hoxa13b-binding elements regulate tailbud expression. (A) Schematic of constructs used to make transgenic fish. The top line shows the position of the various elements in the zebrafish genome. The same elements from the catfish tbxta gene, shown with their location relative to the normal start of tbxta transcription, were also placed in front of GFP. (B-E) GFP expression in transgenic embryos at the gastrula and 20-somite stages. The bottom panels show a magnified view of the tailbud, focused on the midline. In embryos expressing the proximal 2.1 kb promoter only, expression is strong in the gastrula and later in the notochord (arrow), but absent from NMps (arrowhead) and mesoderm (B). With upstream elements added to the proximal promoter, or with the 5.7 kb catfish promoter, expression is strong in the gastrula stage and during somitogenesis, particularly in the somites (C-E). Some expression is observed in the neural tube because GFP expressed in the NMps perdures. Fig. S5 shows a closeup of expression in the posterior somites and a comparison with marker gene expression in the NMps. |
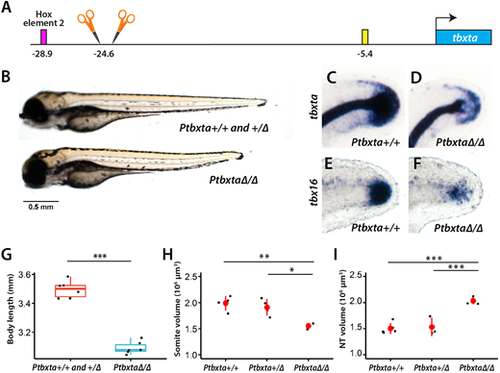
Embryos withHox element 1 deletion have a shorter body and reduced tbxta expression. (A) Two gRNAs flanking Hox element 1 were used to delete the element. (B,G) A cross of heterozygous fish yielded a mixture of embryos with either shorter or longer bodies. The longer-body embryos were genotyped to be either WT or heterozygous, whereas the shorter-body embryos were homozygous for the deletion. The total length of embryos from both genotypes was compared (G, n=6 for each genotype; ***P<0.001, one-way ANOVA). (C-F) Embryos were subjected to in situ hybridization with a tbxta or tbx16 probe and then subsequently genotyped. In embryos that are homozygous for the deletion of Hox element 1, there is reduced expression in NMps and tailbud mesoderm of both markers (D,F) compared with embryos without the deletion (C,E), but normal tbxta expression in the notochord. In the homozygous embryos, the posterior tip of the notochord is visible (D), whereas the posterior end of the embryo is hidden by tailbud tbxta expression in WT embryos (C). The tbxta and tbx16 embryos are at 24 and 28 hpf, respectively. The images show a lateral view, with the dorsal side at the top. (H) Homozygous embryos have defects in the formation of posterior somites, as shown by staining with the muscle antibody MF20 (see Fig. S6A for image). The volume of the posterior somites starting from somite 16 is shown (n=4 for WT and heterozygous, and n=3 for homozygous; *P<0.05, **P<0.01, Tukey HSD test; data are mean±s.d.). (I) Homozygous embryos show an enlarged neural tube (NT) as shown by sox2 FISH (see Fig. S6B for image). The volume of the posterior neural tube starting from the position of the 17th somite is shown (n=5 for WT, n=3 for heterozygous and n=4 for homozygous; ***P<0.001, Tukey HSD test; data are mean±s.d.). The box in the boxplot in G-I shows the upper, middle and lower quantiles of the data; the whiskers represent values outside the middle 50% data. |

A dominant-negative Rbpj blocks expression of tbxta. (A) Embryos were heat shocked at the 10-somite stage and left to develop. The dominant-negative Rbpja (EnR-Rbpja) causes posterior defects. (B-J) Embryos were heat shocked at the 10-somite stage and fixed 5 h post-heat shock. Expression of tbxta in the tailbud is inhibited by EnR-Rbpja (D) (100%, n=19) but not by Rbpja (B,C) (100% for each, n=20 WT and 16 Rbpja), whereas the notochord expression is not inhibited (red arrowhead). The expression of cdx1a and snai1a are not inhibited by EnR-Rbpja (G,J) (100% in all cases, n=minimum of 14 embryos of each type). |
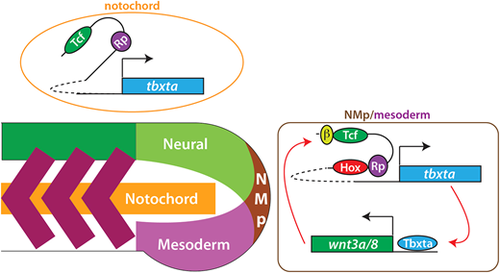
Model of posterior Hox regulation of tbxta expression. Tbxta and Wnt exist in a positive autoregulatory loop, with Tbxta activating wnt3a and wnt8 expression directly (Martin and Kimelman, 2008). We propose that Wnts activate tbxta expression during the somitogenesis stages through the Tcf7/Lef1 (Tcf) sites in Hox element 1 and 2, located far upstream from the tbxta transcription start site, in collaboration with Hox proteins. Although our data specifically show binding of Hoxa13b to these elements, we suggest that all posterior Hox genes (Hox9-13) act through these elements. In addition, Rbpj (Rp) binds to these elements to aid transcriptional activation. In the notochord, the upstream elements are not necessary for expression during the somitogenesis stages. β indicates β-catenin, which is stabilized by Wnt signaling. |