
- Title
-
The Kunitz-type serine protease inhibitor Spint2 is required for cellular cohesion, coordinated cell migration and cell survival during zebrafish hatching gland development
- Authors
- Hatzold, J., Wessendorf, H., Pogoda, H.M., Bloch, W., Hammerschmidt, M.
- Source
- Full text @ Dev. Biol.

A. Phylogenetic tree of protein sequences of zebrafish (Dr), pufferfish (Takifugu rubripes, Tr), clawed frog (Xenopus laevis, Xl), mouse (Mm), and human (Hs) Spint1 and Spint2 proteins. The tree was created using COBALT and the Neigbor Joining method on the NCBI webpage. B. Schematic representation of zebrafish spint2 gene structure. Exons are indicated by rectangles, with coding regions in solid blue, introns are indicated with lines. The arrow head indicates the position targeted by the Crispr guide RNA. C. Schematic representation of Zebrafish Spint2 and Spint1a as well as mouse Spint2 protein domains. KU, Kunitz-type domain; PKD, polycystic kidney disease-like domain; MANEC, motif at N-terminus with eight-cysteines; TM, transmembrane domain. D. Multiple alignment of zebrafish (Dr), pufferfish (Takifugu rubripes, Tr), clawed frog (Xenopus laevis, Xl), mouse (Mm), and human (Hs) Spint2 protein sequences by Clustal Omega. Identical amino acid (aa) residues are indicated by black boxes, similar aa residues by grey boxes. Red lines indicate Kunitz-type domains, green line the transmembrane domain. E.-I. Whole mount in situ hybridization (WISH) with a spint2 probe shows expression in the epidermis and hatching gland cells throughout somitogenesis (E-H) and additional expression in the olfactory epithelium (olf), otic vesicle (ot), and pronephric duct (pd) at 24 hpf (I). J-K. WISH for spint2 at 24 hpf followed by tp63 immunostaining shows expression of spint2 in peridermal cells but not in tp63-positive basal cells in whole mounts (J) and cross sections (K, K′) as well as expression in hatching gland cells (K″). L,M. spint2 WISH in spint2+/+ and −/− embryos at 24 hpf. spint2 signal is not detectable in spint2fr49/fr49 embryos. N. Ethidumbromide agarose gel with genotyping results of embryos obtained from an incross of spint2+/fr49 parents after they had been stained via spint2 mRNA WISH. The obtained staining intensity of the individual embryos is indicated. EXPRESSION / LABELING:
PHENOTYPE:
|

A-C. Cross sections of a 4.5 dpf embryo following spint2 WISH. spint2 expression is strongly detected in the oral epithelium (oe), moderately in the anterior gut (B), and decreasing towards more posterior regions, in contrast to strong spint2 signal in the pronephric ducts (pn) (C). D-G. H&E staining of cross sections of 4.5 dpf spint2 siblings (D, F) and mutants (E, G) showing normal spinal cord morphology (D, E) and gut epithelium (F, G). H–K. H&E staining of cross sections of the rostral intestine of an adult (100 dpf) wild-type sibling (H–I) and a spint2 mutant (J-K). The mutant intestine contains fewer goblet cells (arrows) and a disrupted epithelial integrity. L,M. TUNEL staining of cross sections of the rostral intestine of an 19 dpf juvenile wild-type sibling (L) and a spint2 mutant (M). N,O. Images of an adult (100 dpf) wild-type sibling (N) and a spint2 mutant (O) male raised together. The mutant is of slightly smaller size. P. Quantification of length in mm, weight in mg, and BMI in mg/mm2 of spint2 sibling and mutant males raised together. Dots indicate individual fish, lines represent the mean, and p values were determined by a Student’s t-test. Four experiments/families; 72 individuals. |

A. Percentage of hatched embryos during 48–72 hpf, n = 24–50. B–C. DIC images of hatching gland cells displaying characteristic granules in wild type (B) and spint2 MO (C) at 18 hpf. D-G. WISH of hatching gland marker genes shows unaltered expression of ctslb in wild type (D) and spint2 mutant (E) at end of gastrulation (10 hpf), and of he1.1 in wild type (F) and spint2 morphant (G) at 16 hpf. H-L. WISH of ctslb at 28 hpf showing hatching gland cells that are organized in a belt-like structure in wild type sibling (H), standard control- (J) or 5 mm control morpholino-injected (K) embryo, but disorganized and scattered in spint2 mutant (I) and spint2 morphant (L). M. Quantification of the hatching gland cell phenotype of mutants and morphants shown in H – L. N = 3 independent experiments, n = 53–73 embryos. |
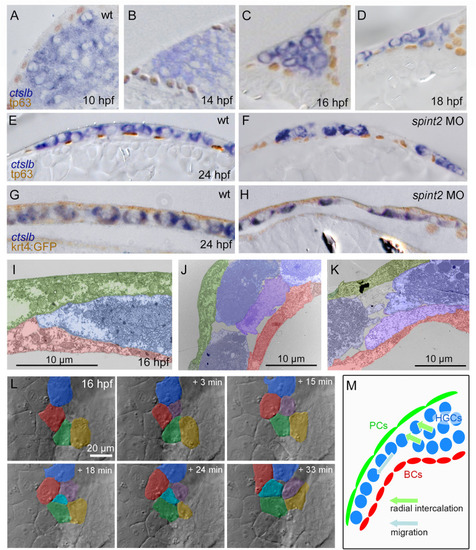
A-F. Sections of embryos stained for ctslb mRNA and tp63 protein. Hatching gland precursor cells are organized in a multi-layered cluster that is located below basal keratinocytes at 10 hpf (A) but above basal keratinocytes at 14 hpf (B) and 16 hpf (C). At 18 hpf, the multi-layered cluster has started to rearrange to a mono-layered organization, which is most advanced at the anterior side of the anlage, where hatching gland cells have started to spread onto the yolk sac (D). At 24 hpf, hatching gland cells are organized in single layer that is a continuous sheet in wild type (E) but has gaps in spint2 morphant (F). G-H. Sections of embryos transgenic for the peridermal marker Tg(krt4:egfp) stained for ctslb mRNA and eGFP protein at 24 hpf. Hatching gland cells are located below the peridermal cells in wild-type (G) and morphant (H) embryos. I–K. TEM sections of wild-type embryos at 16 hpf showing hatching gland cells (HGC, false-colored in blue) in between peridermal cells (PC, false-colored in green) and basal keratinocytes (BC, false-colored in red) at the leading edge of the sheet (I) and at the transition from a bi-to the mono-layered state (J,K). L. Stills from a 33 min DIC time-lapse recording (Supplementary movie 1) of the top layer of hatching gland cells next to the head region, starting at 16 hpf. False-coloring of a subset of hatching gland cells reveals cells intercalating from below. M. Schematic illustrating intercalation and migration events of hatching gland cells around 16 hpf. Hatching gland cells (HGCs) are marked in blue, peridermal cells (PCs) in green, and basal cells (BCs) in red. EXPRESSION / LABELING:
PHENOTYPE:
|

A,B. Fluorescent stills from a time-lapse recording (Supplementary movies 2 and 3) of an embryo transgenic for Tg(-1.8gsc:gfp) and Tg(krt4:tdtomatocaax), starting at 11 hpf (A) and 20 hpf (B). ∗ indicate identical peridermal cells at each time point. Boxed regions in images at 16.5 hpf and 20 hpf indicate regions for which subsequent time-lapse recordings are presented in (F,G,H) at higher magnifications. C,D. TEM sections of contact zones between hatching gland cell (HGC) and peridermal cell (PC) (C) and between HGC and basal keratinocyte (BC) (D) at 16 hpf. The interspace between cells is false-colored in red. E. Quantification of the spaces between hatching gland cells and peridermal and basal cells, respectively. Each dot represents one cell-cell contact. N = 2 embryos, n = 4–5 cells. ∗ indicates p value of 0.0213 determined via a Student’s t-test. F. Bright-field and fluorescent overlay stills from a time-lapse recording (Supplementary movie 4) of multi-layered zone as indicated in third image of (A), in this case of a wild-type embryo with two transplanted GFP-positive cells transgenic for Tg(Ola.Actb:Hsa.hras-egfp), starting at 16.5 hpf. Cells intercalating from below are false-colored in yellow and blue. G,H. Fluorescent stills from time-lapse recordings (Supplementary movies 5 and 6) of HGCs in mono-layered zone as indicated in third image of A (G) and first image of B (H) of wild-type embryos injected with a 1.8gsc:LifeAct-Ruby plasmid labeling active actin cytoskeletal rearrangements, starting at 16.5 hpf (G) or 20 hpf (H). L,M. TEM sections through HGCs (false-colored in blue) between peridermal cells (PC, false-colored in green) and basal keratinocytes (BC, false-colored in red) at 16.5 hpf (L) or 20 hpf (M). I–K. Confocal images of cell membranes of HGCs of embryos transgenic for Tg(Ola.Actb:Hsa.hras-egfp) to label cell membranes at 16.5 hpf (I), 20 hpf (J), or 24 hpf (K). N. Quantification of aspect ratio of HGCs shown in I–K in violin blot; N = 5–9 embryos, n = 39–72 cells; ∗∗∗ indicates p value of 0.0001 determined via one-way ANOVA and Tukey’s post hoc test, non-significant differences are not indicated. O. Tukey box and whiskers plot displaying the percentages of neighbors of HGCs that were lost during a tracking period of 50 min in embryos transgenic for Tg(-1.8gsc:gfp), starting at 16.5 hpf or 20 hpf (see also Fig. 6A and I). N = 3 embryos each, n = 28–57. ∗∗ indicates p value of 0.0013 determined via Student’s t-test. EXPRESSION / LABELING:
PHENOTYPE:
|

A-B. Fluorescent stills of time-lapse recordings of embryos transgenic for Tg(-1.8gsc:gfp) starting at 16.5 hpf, showing less-organized migration routes of individual hatching gland cells in spint2 morphants (B) compared to wild type (A). A subset of cells is false-colored. C-D. Migration routes of 20 individual hatching gland cells tracked for 90 min starting at 16.5 hpf in a wild-type embryo (C) and spint2 morphant embryo (D), determined using the Axiovision software. The color code indicates the frame number from 0 (16.5 hpf; dark blue) to 20 (18 hpf; red). E,F. Quantification of the absolute migration distance (E) and directional persistence determined by the ratio of the linear displacement to the absolute migration distance (F) of hatching gland cells tracked in C and D; Tukey box and whiskers plot; N = 3 embryos, n = 20 cells; p = 0.7271 (ns) or <0.0001 (∗∗∗∗) (Student’s t-test). G. Rose blots displaying the angle of the migration directionality of individual cells tracked in C and D relative to the average angle of all cells. Each field indicates one cell. H. Quantification of the number of lost cell-cell contacts of neighboring cells tracked for 50 min in wild-type and spint2 morphant embryos starting at 16.5 hpf; N = 3, n = 72–255, p = 0.0023 (Student’s t-test); each dot represents the average percentage of lost contacts in one embryo, error bars represent the standard deviation. I. Tukey box and whiskers plot representing the percentage of neighbors of a cell that were lost during a tracking period of 50 min starting at 16.5 hpf in wild-type (also shown in Figure 5O) and spint2 morphant embryos; N = 3 each, n = 28–64; ∗∗∗∗ indicates p value < 0.0001 determined via Student’s t-test. J-M. Live confocal images of hatching gland cells of embryos transgenic for Tg(Ola.Actb:Hsa.hras-egfp) at 18 hpf (J,K) or 24 hpf (L,M). Hatching gland cells display a polygonal shape in wild-type and early spint2 morphants (J,K,L) but are rounded up in 24 hpf spint2 morphants (M) Arrowheads point to detachments between adjacent HGCs. N,O. Quantification of the cell shape of HGCs shown in J-M. Violin plots show that the circularity (perfect circular shape = 1; elongated shapes <1) as well as the solidity (perfect convex shape = 1; gonal shapes <1) indices are not different in wild-type and spint2 morphants at 18 hpf but increased (more circular and less polygonal) in spint2 morphants at 24 hpf; N = 5–12 embryos, n = 51–94 cells; ∗∗ indicates p value of 0.008, ∗∗∗∗ indicates p value < 0.0001 determined via one-way ANOVA and Tukey’s post hoc test. EXPRESSION / LABELING:
PHENOTYPE:
|
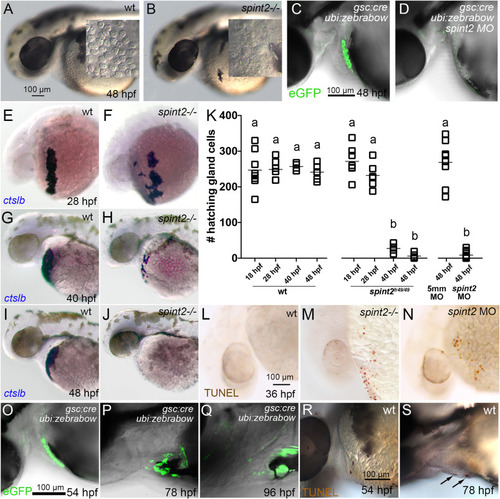
A-B. DIC images of the head and yolk region of 48 hpf old wild-type (A) and spint2fr49/fr49 mutant (B) embryos. Inlets show a magnified view of the hatching gland cell region, in which granule-containing cells are observed in wild-type but not in mutant embryos. C-D. Overlay of DIC and fluorescent images of 48 hpf embryos transgenic for Tg(gsc:Cre)fr44Tg and Tg(ubi:Zebrabow-M)a131. In wild type (C) gfp-expressing hatching gland cells are visible, whereas they are absent in spint2 morphant (D). E-K. WISH of ctslb in wild-type siblings (E,G,I) and spint2 mutants (F,H,J), revealing similar numbers of hatching gland cells in mutants and wild-type siblings at 28 hpf, but progressively fewer hatching gland cells in mutants compared to wild types at 40 hpf and 48 hpf. K. Quantification of numbers of ctslb-positive hatching gland cells at 18 hpf, 28 hpf, 40 hpf, 48 hpf in wild-type and spint2 mutant embryos, and at 48 hpf in spint2 morphants and siblings injected with 5-mismatch (5 mm) control MO. Squares represent single embryos; significances were determined via a one-way ANOVA and Tukey’s post hoc test. Different letters indicate statistically significant differences (p < 0.0001). L-N. TUNEL staining of wild-type (L), spint2 mutant (M) and spint2 morphant (N) embryos at 36 hpf. spint2-deficient embryos display cell death in the hatching gland cells region. O–S. Wild-type hatching gland cells die after hatching. O-Q. Overlays of DIC and fluorescent images of embryos transgenic for Tg(gsc:Cre)fr44Tg and Tg(ubi:Zebrabow-M)a131, showing GFP-positive hatching gland cells shortly after embryos have hatched at 54 hpf (O) but their subsequent loss over the next two days (P,Q). R,S. TUNEL staining of wild-type embryos showing no positive TUNEL cells in the hatching gland tissue in a 54 hpf embryo (R) but few TUNEL-positive hatching gland cells at 78 hpf (S). |

A. Overlay of DIC and fluorescent image of live 24 hpf wild-type host, in which endogenous mesendoderm was chemically suppressed, and which was transplanted with polster cells (precursors of hatching gland cells) of a wild-type donor labeled with membrane-bound GFP (via transgene Tg(Ola.Actb:Hsa.hras-egfp)). B. Magnified view of fluorescently labeled hatching gland cells in A. C. Magnified view of fluorescently labeled wild-type hatching gland cells whose precursors had been transplanted into a spint2 morphant host, as in A. D. Magnified view of fluorescently labeled spint2 morphant hatching gland cells whose precursors had been transplanted into a wild-type host, as in A. E. Stills of a time-lapse recording of GFP-labeled spint2 morphant donor cells in a wild-type host at 30 hpf in 5 min intervals. Red arrowhead points to a cell undergoing cell death. F–I. Immunofluorescence of Cdh1 (E-cadherin) in hatching gland cells at 18 hpf. In whole mounts, cell contacts between wild-type hatching gland cells show continuous Cdh1 (red) localization (F), whereas in spint2fr49/fr49 mutants, Cdh1 localization is disrupted (G). Immunofluorescence on sections showing comparable Cdh1 levels (green) at apical and basal membranes of wild-type (H) and spint2 morphant (I) embryos but reduced Cdh1 levels at lateral membranes (indicated by arrowheads) between hatching gland cells of spint2 morphant. J. Tukey box and whiskers plot showing a decreased ratio of the mean intensity of CDH1 on lateral versus apical cell junctions of HGCs in spint2 morphant embryos compared to wild-type controls; N = 3 embryos, n = 36–38; ∗∗∗ indicates p value of 0.0002 determined via Student’s t-test. K–N. Transmission electron microscopy (TEM) sections of wild-type (K) and spint2 morphant (L) embryos at 16 hpf, and of wild-type (M) and spint2fr49/fr49 mutant (N) embryos at 19 hpf, with intercellular spaces false-colored in red. Interspaces between hatching gland cells (HGC) and peridermal cells (PC) of spint2 morphant and wild-type control are unaltered (K,L), whereas interspaces between adjacent hatching gland cells (HGC) are increased in spint2fr49/fr49 embryo compared to wild-type sibling (M,N). EXPRESSION / LABELING:
PHENOTYPE:
|

A-C. ctlsb WISH displays normal distribution of hatching gland cells in 34 hpf embryos injected with low amounts of spint2 MO (A) and low amounts of cdh1 MO (B), but a scattered hatching gland phenotype in embryos injected with both (C). Wild-type and full spint2 MO controls as used for quantification (D) are not shown, but compare with Fig. 3, Fig. 7E,F for 28 hpf. D. Quantification of the scattered hatching gland phenotype analyzed at 34 hpf; n = 7–31. E-I. TUNEL staining of 36 hpf embryos shows no TUNEL-positive cells on yolk sac in wild type (E) and in embryos injected with low amounts of spint2 MO (F) or low amounts of cdh1 MO (G), but multiple in embryo injected with low amounts of both (H), and even more in full spint2 morphant (I). J. Quantification of hatching gland cell (HGC) numbers scored by ctslb WISH of 44 hpf embryos injected with different MOs. Squares represent individual embryos; significances were determined via a one-way ANOVA and Tukey’s post hoc test. Different letters indicate statistically significant differences (p < 0.0001). K. Quantification of percentages of embryos hatched after 3 dpf, injected with different MOs; N = 3, n = 25–94. Significances were determined via a one-way ANOVA and Tukey’s post hoc test. Different letters indicate statistically significant differences (p < 0.0001). L-O. Forced expression of spint2 or cdh1 restores polygonal shapes of spint2 morphant hatching gland cells. L,M. Confocal images of 24 hpf spint2 morphant embryos transgenic for Tg(bact:tdtomato-caax) with mosaic expression of eGFP together with spint2 (L) or cdh1 (M). N,O. Quantification of cell shapes as shown in panels L and M. Violin plots show that compared to regular spint2 morphant control hatching gland cells (GFP-), the circularity (N) as well as solidity (M) indices of spint2 morphant hatching gland cells expressing spint2 or cdh1 (GFP+) are decreased and more similar to wild-type values (compare with Fig. 6N and O); N = 5–8 embryos, n = 38–82 cells; ∗∗∗∗ indicates p value < 0.0001 determined via one-way ANOVA and Tukey’s post hoc test. |
Reprinted from Developmental Biology, 476, Hatzold, J., Wessendorf, H., Pogoda, H.M., Bloch, W., Hammerschmidt, M., The Kunitz-type serine protease inhibitor Spint2 is required for cellular cohesion, coordinated cell migration and cell survival during zebrafish hatching gland development, 148-170, Copyright (2021) with permission from Elsevier. Full text @ Dev. Biol.