
- Title
-
Antidepressant Screening Demonstrated Non-Monotonic Responses to Amitriptyline, Amoxapine and Sertraline in Locomotor Activity Assay in Larval Zebrafish
- Authors
- Suryanto, M.E., Audira, G., Uapipatanakul, B., Hussain, A., Saputra, F., Siregar, P., Chen, K.H., Hsiao, C.D.
- Source
- Full text @ Cells

Schematic diagram of the experimental design to evaluate the potential adverse effects of 1 mg/L of 18 different antidepressants in zebrafish larvae. The experimental workflow for antidepressant exposure and locomotor activity measurement for larval zebrafish are illustrated in the upper panel. During locomotion assay, three major endpoints, including total distance traveled, burst count, and rotation count were measured and compared (top-right panel). Finally, two mathematic tools of principal component analysis and hierarchical clustering were used to reduce data complexity and perform similarity grouping (bottom-right panel). |

Comparison of (A,B) total distance traveled, (C,D) average burst movement, and (E,F) rotation count of zebrafish larvae in light and dark cycles, respectively. The statistical significance was tested by Mann–Whitney test. Every treated group was statistically compared to the control group individually. Data are presented as median with 95% CI for (A,B), and as mean with SEM for (C–F). Blue asterisk indicates a significant decrease in the value and red asterisk indicates a significant increase in the value in comparison to the control group (n = 144 for control, n = 48 for each tested antidepressant; * p < 0.05, ** p < 0.01, *** p < 0.001, **** p < 0.0001). The details of these two-way ANOVA test results can be found in Table S1. |
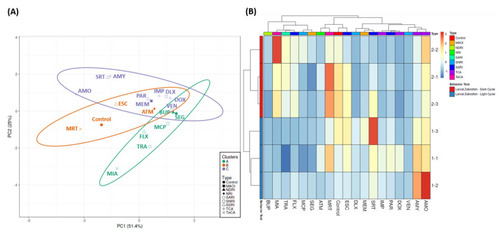
(A) Principal component analysis (PCA) and (B) hierarchical clustering analysis of locomotion behavior endpoints in zebrafish larvae after exposure to 1 mg/L of 18 different antidepressants. The untreated group is included as the control group. In (A), three major clusters from hierarchical clustering analysis results are marked with purple (1st cluster), orange (2nd cluster), and green (3rd cluster). |

Comparison of (A,D,G,J,M,P) average total distance traveled, (B,E,H,K,N,Q) average burst movement, and (C,F,I,L,O,R) rotation count of zebrafish larvae after 1-day exposure of 0 (control), 1, 10, and 100 ppb of AMY, AMO, and SRT during both light and dark cycles. The statistical different significances between each treated group were statistically compared to the control group by Kruskal–Wallis test continued with Dunn’s multiple comparisons test. All of the data are presented as mean ± SEM. Blue asterisk indicates a significant decrease in the value and red asterisk indicates a significant increase in the value in comparison to the control group (n = 167 for control, n = 96 for each concentration of tested antidepressants group, except 10 ppb AMY group (n = 95), * p < 0.05, ** p < 0.01, *** p < 0.001, **** p < 0.0001). The details of these Kruskal–Wallis tests can be found in Table S3. |