
- Title
-
Characterization of Biological Pathways Regulating Acute Cold Resistance of Zebrafish
- Authors
- Ren, J., Long, Y., Liu, R., Song, G., Li, Q., Cui, Z.
- Source
- Full text @ Int. J. Mol. Sci.
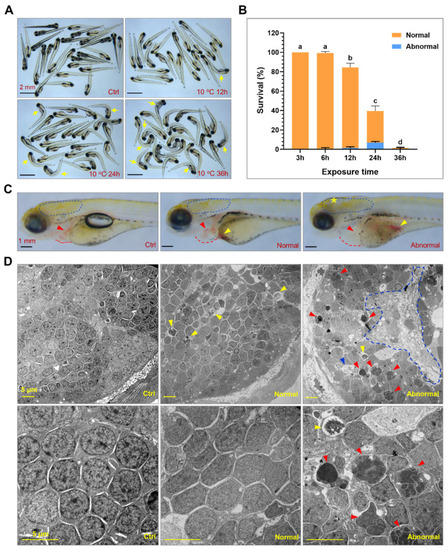
Exposure to lethal cold stress resulted in irreversible and systematic tissue damage. (A) Photos of zebrafish larvae exposed to 10 °C for different time periods. The controls (ctrl) were the larvae developed to 120 hpf under 28 °C. The yellow arrows indicate dead fish. (B) Survival rates of larvae under lethal cold stress. The larvae at 96 hpf were exposed to 10 °C for indicated time periods. After recovered at 28 °C for 24 h, the larvae were classified as normal and abnormal based on their morphologies and ability to swim. Different letters above the error bars indicate significant difference (n = 4, p < 0.05). (C) Representative photos of the control, normal and abnormal larvae. The circles of dashed blue lines indicate brain. The red and yellow arrows indicate heart and red blood cells accumulated in the yolk sac. The yellow star indicates damage in the brain. The red dashed lines indicate border of pericardial cavity. (D) Transmission electron microscopy disclosed cold-induced cell death in the brain. The brain of zebrafish larvae (indicated by the dashed blue line circles in (C) was ultrathin-sectioned and imaged. The blue, red and yellow arrow heads indicate the cells undergoing necrotic, apoptotic and autophagic death, respectively. The circle of blue dashed line indicates area of necrosis. Photos of the lower panel are magnified regions of those of the upper panel. |

Transcriptional landscapes of zebrafish larvae exposed to lethal cold stress and rewarming. (A) Samples used for RNA-seq. Four groups of samples were included in the analysis: the controls (ctrl) maintained at 28 °C; samples exposed to 10 °C lethal cold (lc) stress; samples exposed to 10 °C cold stress for 12 h and then recovered at 28 °C (re); samples containing the normal (er_nor) and abnormal (er_ab) fish after 24 h of both cold exposure and recovery. (B) Results of the principal component analysis (PCA) indicate trajectories of gene expression changes during normal development, upon cold stress and recovery. Some data points were omitted for the readability of the chart. (C) Expression of the top 100 genes with the highest loadings for PC1 and PC2. (D) Numbers of differentially expressed genes (DEGs). Three series of DEGs were displayed, development related (dr), cold stress regulated (lc) and genes differentially expressed during recovery (re). (E) Venn analysis for the DEGs identified by different comparisons. The source and number of DEGs are displayed; dr, lc and re, the same as in (D), er indicates DEGs between the normal and abnormal fish after cold exposure and recovery. Genes highlighted with the red diamond were used to identify potential molecular markers for cold-induced damage. |

Clustering analysis, gene ontology (GO) enrichments and coexpression networks of the DEGs. (A) K-means clustering of the DEGs. Numbers of the clusters are displayed on the left. Numbers of genes in each cluster are shown on the right. The color scale indicates row z-score. (B) GO enrichments (biological process) for the representative clusters. (C) Hub genes of the indicated clusters. The gene coexpression network for each cluster was constructed by weighted gene coexpression network analysis (WGCNA) and the top 15 genes with the highest maximal clique centrality (MCC) were shown. The top 3 hubs were located in the middle of the circle. Color of node is proportional to the MCC. (D) Eigengene depicting overall gene expression of the representative clusters and expression of the top 3 hubs. |

Identification of potential molecular markers for cold-induced damage. (A) Venn analysis to identify genes exclusively affected by exposure to lethal cold stress. The 1134 genes representing the intersection among DEGs affected by lc, re and er (Figure 2E) were compared with the 2137 genes previously found to be upregulated by 24-h acclimation to a mild low temperature (18 °C) [17]. (B) Cluster dendrogram of the 959 genes exclusively related to lethal cold stress exposure. The genes were classified into 4 modules by WGCNA. (C) Heat map indicating eigengenes of the 4 modules. The number of genes in each module is shown on the right. The color scale indicates row z-score. (D) Enriched GO terms for the genes of module 1. The nodes represent GO terms and the edges indicate relationships between the nodes. Size of nodes is proportional to the number of genes associated with the term. The color scale indicates FDR (false discovery rate) of the enrichment analysis. (E) Western blots indicate changes in the level of phosphorylated histone H3 upon cold stress and during rewarming. Numbers below the blots are ratios of the phosphorylated histone H3 (p-H3) to total histone H3 (t-H3). (F) Network chart indicates hub genes of module 1. Names of the top 10 hub genes are highlighted. Size of the nodes is proportional to the maximal clique centrality. |

Kyoto encyclopedia of genes and genomes (KEGG) pathway enrichments for the genes differentially expressed upon cold stress and subsequent rewarming. ( |

Functions of ERK and p38 MAPKs in regulating cold resistance of zebrafish larvae. (A) Exposure to cold stress induced phosphorylation of ERK and p38 MAPKs. (B) Phosphorylation level of ERK and p38 MAPKs decreased during recovery at 28 °C. (C) PD0325901 treatment completely inhibited phosphorylation of ERK. (D) SB203580 treatment partially decreased phosphorylation of p38 MAPKs. The line charts below the Western blots indicate ratio of the phosphorylated ERK and p38 to the total protein. (E,F) Inhibiting the activity of ERK (E) and p38 (F) sensitized zebrafish larvae to cold stress. PD0325901 (5 μM) and SB203580 (50 μM) were added to the medium upon lethal cold exposure to inhibit the activity of ERK and p38, respectively. |

Effects of inhibiting Foxo1, autophagy, apoptosis and necroptosis on cold resistance of zebrafish larvae. (A,B) Treatment with AS1842856 (0.5 μM), an inhibitor of Foxo1 (A) and Bafilomycin A1 (50 nm), an inhibitor of autophagy (B), sensitized zebrafish larvae to cold stress. (C,D) Treatment with Ac-DEVD-CHO (5 μM), an inhibitor of Group II caspases (C) and Necrostatin-1 (50 μM), a specific RIP1 (RIPK1) inhibitor and inhibits TNF-α-induced necroptosis (D) increased survival of zebrafish larvae exposed to lethal cold stress. |

Characterization of the molecular mechanisms underlying functions of Foxo1, ERK and p38 MAPKs in regulating cold resistance. (A) Samples used for RNA-seq. Zebrafish larvae at 96 hpf were exposed to 10 °C or maintained at 28 °C for 12 h in the presence of inhibitors for Foxo1 (AS: AS1842856, 0.5 μM), ERK (PD: PD0325901, 5 μM) or p38 MAPKs (SB: SB203580, 50 μM). DMSO is the vehicle control. (B) KEGG pathway enrichments of the DEGs between samples exposed to 10 °C in the presence of inhibitors (AS, upper panel; PD, lower panel) and the vehicle control (10 °C_DMSO). (C) Venn plots demonstrate the cold-responsive genes (CRGs) affected by the inhibitors. The genes up or down-regulated by cold stress (10 °C_DMSO vs. 96 hpf) were compared to those down-or up-regulated by the corresponding inhibitors (10 °C_AS/PD/SB vs. 10 °C_DMSO). (D) Heat map indicates the representative CRGs inhibited by AS1842856 and PD0325901. (E) Working model illustrating molecular mechanisms of Foxo1, ERK and p38 MAPKs in regulating cold resistance of zebrafish. |