FIGURE SUMMARY
Title

The Regenerating Adult Zebrafish Retina Recapitulates Developmental Fate Specification Programs

Authors
Lahne, M., Brecker, M., Jones, S.E., Hyde, D.R.
Source
Full text @ Front Cell Dev Biol

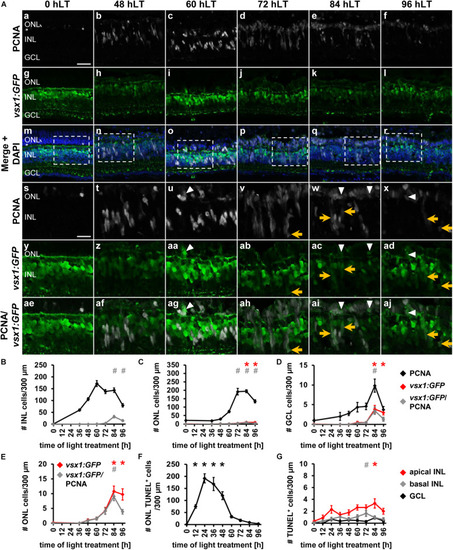
Generation of all neuronal cell types and expression of cell type specific developmental competence factors in the light-damaged retina. (Aa–d) Single z-plane confocal images of retinal sections from light-damaged EdU-injected albino zebrafish (Aa,c,d) at 7 days of recovery (drec) immunolabeled for the amacrine/ganglion cell marker, HuC/D (Ab–d), and counterstained with the nuclear dye, DAPI (Ad). Yellow arrowhead, GCL EdU-positive ganglion or amacrine cell; yellow arrow, INL EdU-positive amacrine cell; white arrowhead, EdU-positive and HuC/D-negative cell in the apical INL, the region where bipolar cells reside; white arrow, EdU-positive cell in the cone nuclear layer. Insets represent the EdU-positive cells in panels (Aa–d) (arrows; yellow arrowhead) displayed at higher magnification. Scale bar, 20 μm in panel (Aa). (B) Schematic of the experimental paradigm: albino zebrafish were exposed to constant intense light for 96 h and subsequently recovered under normal light conditions until 7 drec. Fish were intraperitoneally injected with EdU at 24, 36, 48, 60, 72, 84, 96 hLT and at 1 and 2 drec (red arrows). AC, amacrine cell; C, cone photoreceptor cell; GC, ganglion cell; GCL, ganglion cell layer; hLT, hours of light treatment; INL, inner nuclear layer; ONL, outer nuclear layer; R, rod photoreceptor cell. (C–I) Line plots displaying mRNA expression levels as log2-fold changes relative to 0 h controls for proliferation marker, pcna(C) and genes required for the developmental specification of retinal neurons (D–I) during light damage-induced retinal regeneration (0, 36, 48, 60, 72, 84, 96 hLT, 2, 5, 7 drec): (D)atoh7 (ganglion cells); (E)ptf1a (amacrine/horizontal cells); (F)otx2 (bipolar and photoreceptor cells); (G)vsx1 (bipolar cell); (H)prdm1a (photoreceptor cell); (I)nrl (gray line, rod photoreceptor cell specification) and mature rod photoreceptor cell gene, rhodopsin (black line).

Ganglion cell competence factor atoh7 is upregulated in the light-damaged retina. (Aa–aj) Single z-plane confocal images of retinal sections from light-damaged Tg[atoh7:GFP]rw021 zebrafish (0, 48, 60, 72, 84, 96 hLT) immunolabeled for PCNA (Aa–f,As–ad), GFP (Ag–l,As–aj), HuC/D (Am–x,Aae–aj) and counterstained with DAPI (As–x). (Ay–aj) Regions outlined in panels (As–x) at higher magnification. Yellow arrows, atoh7:GFP, PCNA and HuC/D-triple positive cells. Red outlined arrowheads, atoh7:GFP and HuC/D-double positive cell that is PCNA-negative. Scale bars, 20 μm (Aa) and 10 μm (Ay). (B–D) Number of PCNA-positive, atoh7:GFP-positive and PCNA and atoh7:GFP-double positive cells in the INL (B), ONL (C), and GCL (D) over the light treatment timecourse. (E–G) Number of atoh7:GFP-positive cells and atoh7:GFP and PCNAdouble positive cells in comparison to atoh7:GFP and HuC/D-double positive and PCNA and HuC/D-double positive cells in the INL (E), ONL (F), and GCL (G) of retinas exposed to constant intense light for 0, 36, 48, 60, 72, 84, and 96 h. Mean ± SE, n ≥ 12, *pTukey < 0.05 and #p < 0.05 indicate comparisons to 0 hLT for the different measures that were assessed. The symbols are color-coded according to the line that they represent in the corresponding graphs (pANOVA, see Table 1). Significance was not determined for PCNA in panels (B–D) and symbols indicating significance for atoh7:GFP and atoh7:GFP and PCNA-double-positive cells are not shown in panels (E–G), as they are indicated in panels (B–D). PCNA, Proliferating Cell Nuclear Antigen.

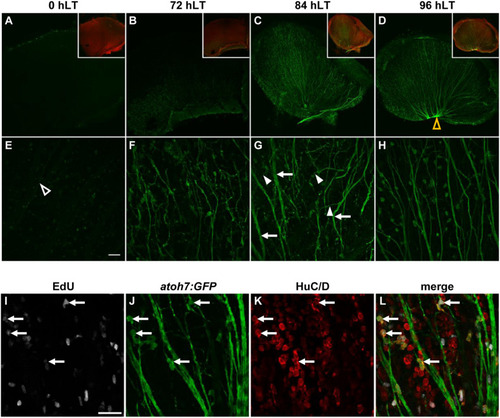
Newly generated ganglion cells extend axons. (A–H) Confocal images of dorsal retinal flatmounts from light-damaged Tg[atoh7:GFP]rw021 zebrafish (0, 72, 84, 96 hLT) immunolabeled for GFP (A–H) and phosphorylated gap43 to identify the nerve fiber layer (A–D, inset) at lower (A–D, single z-plane) and higher magnification [(E–H); maximum projections of five z-levels of the GCL]. Open yellow arrowhead, optic nerve head (D). Open white arrowhead, thin axonal projection (E). Filled arrowheads, neurites extending at an angle relative to thickened axon tracks (arrows). Scale bar, 50 μm (E). (I–L) Single z-plane confocal images of an EdU-injected (I,L)Tg[atoh7:GFP]rw021 dorsal retinal flatmount at 96 hLT immunolabeled for GFP (J,L) and HuC/D (K,L). Arrows indicate newly generated ganglion or amacrine cells. Scale bar, 20 μm (I).

Amacrine and horizontal cell competence factor ptf1a is upregulated in the light-damaged retina. (Aa–aj) Single z-plane confocal images of retinal sections from light-damaged Tg[ptf1a:EGFP]jh1 zebrafish (0, 48, 60, 72, 84, 96 hLT) immunolabeled for PCNA (Aa–f,As–ad), GFP (Ag–l,As–aj), HuC/D (Am–x,Aae–aj) and counterstained with DAPI (As–x). (Ay–aj) Regions outlined in panels (As–x) at higher magnification. Arrowhead, ptf1a:EGFP-positive ONL cell with an elongated morphology. Yellow arrows, ptf1a:EGFP, PCNA and HuC/D-triple positive cell. Red arrows, ptf1a:EGFP and HuC/D-double positive cell that is PCNA-negative. (B–D) Number of PCNA-positive, ptf1a:EGFP-positive and PCNA and ptf1a:EGFP-double positive cells in the INL (B), ONL (C), and GCL (D) over the light treatment timecourse. (E–G) Number of ptf1a:EGFP-positive, ptf1a:EGFP and PCNAdouble positive cells in comparison to ptf1a:EGFP and HuC/D-double positive and PCNA and HuC/D-double positive cells in the INL (E), ONL (F), and GCL (G) of retinas exposed to constant intense light for 0, 36, 48, 60, 72, 84 and 96 h. Mean ± SE, n ≥ 10, *pTukey < 0.05 and #p < 0.05 indicate comparisons to 0 hLT for the different measures that were assessed. The symbols are color-coded according to the line that they represent in the corresponding graphs (pANOVA, see Table 1). Note, significance was not determined for PCNA in panels (B–D) and symbols indicating significance for ptf1a:EGFP and ptf1a:EGFP and PCNA-double-positive cells are not shown in panels (E-G), as they are indicated in panels (B–D). (Ha–c) Maximum projections of five confocal z-sections at the level of the inner plexiform/amacrine cell layer in light-damaged Tg[ptf1a:EGFP]jh1 dorsal retinal flatmounts at 96 hLT. Newly generated ptf1a:EGFP-positive amacrine cells (Ha,c) identified by EdU [(Hb,c); arrows], which was intraperitoneally injected during the proliferative phase, display neurite outgrowth (arrowheads). The images are representative of three independent experiments. (I) Higher magnification confocal images of the horizontally elongated ptf1a:EGFP-positive ONL cell at 96 hLT in panel (Al) (arrowhead), which potentially represents a newly generated horizontal cell. Confocal images also display HuC/D (Ia,b), PCNA (Ib) and DAPI (Ib). Scale bars, 20 μm (Aa, Ha) and 10 μm (Ay, Ia).

Competence factor of red cone precursor cells, thrb, is upregulated in the light-damaged retina. (Aa–aj) Single z-plane confocal images of retinal sections from light-damaged Tg[thrb:Tomato]q22 zebrafish (Ag–l,As–aj), (0, 48, 60, 72, 84, 96 hLT) immunolabeled for PCNA (Aa–f,As–ad) and the red/green double cone marker, Zpr-1 (Am–x,Aae–aj) and counterstained with DAPI (As–x). (Ay–aj) Regions outlined in panels (As–x) at higher magnification. Arrows, thrb:Tomato-positive INL cells. Scale bars, 20 μm (Aa) and 10 μm (Ay). (B,C) Number of PCNA-positive, thrb:Tomato-positive and PCNA and thrb:Tomato-double positive cells in the INL (B) and ONL (C) over the light treatment timecourse. (D) Number of thrb:Tomato-positive and thrb:Tomato and PCNA-double positive cells in the INL at a different scale to (B). (E) Number of thrb:Tomato-positive, thrb:Tomato and PCNA-double positive cells in comparison to Zpr-1-positive cells and thrb:Tomato, PCNA and Zpr-1-triple positive cells in the ONL of retinas exposed to constant intense light for 0, 36, 48, 60, 72, 84 and 96 h. Mean ± SE, n ≥ 9, pTukey < 0.05 and #p < 0.05 indicate comparisons to 0 hLT for the different measures that were assessed. The symbols are color-coded according to the line that they represent in the corresponding graphs (pANOVA, see Table 1). Note, significance was not determined for PCNA in panels (B,C) and symbols indicating significance for thrb:Tomato-positive and thrb:Tomato and PCNA-double-positive cells are not shown in panel (E), as they are indicated in panel (C). (F) Single z-plane confocal images of retinal sections from Tg[thrb:Tomato]q22 zebrafish (Fa–d,g,h) co-labeled with Zpr-1 (Fe–h) and DAPI (Fa,b) at 96 hLT [cells indicated by arrowhead in panel (Aad) at higher zoom] and 2 drec. Arrowheads illustrate the presence of small inner/outer segments. Astericks, thrb:Tomato and Zpr-1 double positive cells. Arrows, Zpr-1-positive and thrb:Tomato-negative cells. Scale bar, 10 μm.

Bipolar cell competence factor vsx1:GFP is expressed in proliferating cells in the light-damaged retina. (Aa–aj) Single z-plane confocal images of retinal sections from light-damaged TgBAC[vsx1:GFP]nns5 zebrafish (0, 48, 60, 72, 84, 96 hLT) immunolabeled for PCNA (Aa–f,Am–x,Aae–aj), GFP (Ag–r,Ay–aj) and counterstained with DAPI (Am–r). (As–aj) Regions outlined in panels (Am–r) at higher magnification. Scale bars, 20 μm (Aa) and 10 μm (As). (B–D) Number of PCNA-positive, vsx1:GFP-positive and PCNA and vsx1:GFP-double positive cells in the INL (B), ONL (C), and GCL (D) over the light treatment timecourse. (E) Number of vsx1:GFP-positive and vsx1:GFP and PCNAdouble positive cells in the ONL at a different scale. (F,G) Number of TUNEL-positive cells in the ONL (F) and in the inner retina (G), (apical INL, basal INL, GCL) following constant intense light treatment for 0, 12, 24, 36, 48, 60, 72, 84 and 96 h. Mean ± SE, n ≥ 10. *pTukey < 0.05 and #p < 0.05 indicate comparisons to 0 hLT for the different measures that were assessed. The symbols are color-coded according to the line that they represent in the corresponding graphs (pANOVA, see Table 1). Note, significance was not determined for PCNA in panels (B–D).

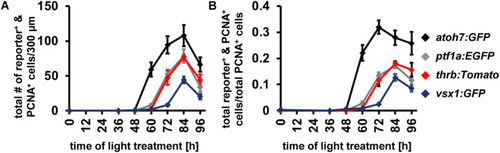
Comparison of the temporal expression patterns of neuronal competence factors in the light-damaged retina. (A,B) Total number (ONL, INL, and GCL combined) of atoh7:GFP-, ptf1a:EGFP-, thrb:Tomato- and vsx1:GFP-positive cells (i.e., reporter-positive cells) that express PCNA (A) and when normalized to the total number of PCNA-positive cells (B) at 0, 36, 48, 60, 72, 84, and 96 hLT. Mean ± SE, n ≥ 9.

Expression of developmental competence factors and generation of all neuronal cell types following rod photoreceptor cell death in a genetic ablation model. (A–E) Line plots displaying mRNA expression levels expressed as log2-fold changes relative to 0 h controls for pcna(A), atoh7(B), ptf1a(C), prdm1a(D), nrl (E, gray line), and rhodopsin (E, black line) following metronidazole-induced rod photoreceptor cell death in Tg[rho:Eco.NfsB-EGFP]nt19 zebrafish (24, 48, 72, 96, and 120 h after metronidazole treatment onset). Mean ± SE, n ≥ 3. (F) Schematic of the experimental paradigm: Tg[rho:Eco.NfsB-EGFP]nt19 zebrafish were either exposed to metronidazole (mtz) or system water (H2O) for 24 h and subsequently recovered in system water for 10 days (10 drec). Intraperitoneal EdU injections at the indicated timepoints (red arrows). (Ga–h,H,L) Single z-plane confocal images of retinal sections from metronidazole or water-exposed EdU-injected Tg[rho:Eco.NfsB-EGFP]nt19 zebrafish (Ga,b,g,h) at 10 drec that were labeled for GFP (Gc,d,g,h), HuC/D (Ge–h), and DAPI (Gg,h). Arrowhead, GCL EdU-positive ganglion/amacrine cell; yellow arrow, INL EdU-positive amacrine cell; white arrow, EdU-positive cell in the cone nuclear layer. Scale bar, 20 μm (Ga). (H) EdU-positive cells in panel (Ab) (arrows, white arrowhead) at higher magnification. (I) Number of EdU-positive cells in the cone nuclear layer, apical and basal INL and those identified as rod photoreceptor cells by co-labeling with rho:Eco.NfsB-EGFP, as amacrine and ganglion cells based on the expression of HuC/D in the basal INL or GCL, respectively, at 10 drec following exposure of Tg[rho:Eco.NfsB-EGFP]nt19 zebrafish to either system water (control) or metronidazole for 24 h. Mean ± SE, n ≥ 9, Student’s t-test, p < 0.05. (J,K) Single z-plane confocal images from water or metronidazole-exposed EdU-injected (Ja,b,e,f,Kc–f)Tg[rho:Eco.NfsB-EGFP]nt19 zebrafish at 10 drec that were labeled for Zpr-1 (Jc–f) or PKCα (Ka–f) and counterstained with DAPI (Ke,f). Yellow arrowheads (J), Zpr-1 & EdU-double positive cells; white arrowhead (K), PKCα & EdU-positive cell. (L) EdU & HuC/D-double positive ONL cell (yellow arrowhead) in panel (G) at higher magnification. aINL, apical inner nuclear layer; bINL, basal inner nuclear layer; CL, cone nuclear layer; RL, rod nuclear layer; mtz, metronidazole.

Comparison of the temporal expression patterns of neuronal competence factors in the NMDA-damaged retina. (A,B) Total number (ONL, INL, and GCL combined) of atoh7:GFP-, ptf1a: EGFP-, thrb:Tomato- and vsx1:GFP-positive cells (i.e., reporter-positive cells) that express PCNA (A) and when normalized to the total number of PCNA-positive cells in NMDA-damaged retinas (B). Mean ± SE, n ≥ 7. (C,D) Number of transgene-positive cells, transgene-positive cells that express PCNA and those that are triple-positive for the transgene, PCNA and HuC/D as well as the number of HuC/D and PCNA-positive cells in the INL of NMDA-exposed Tg[atoh7:GFP]rw021(C) and Tg[ptf1a:EGFP]jh1 zebrafish retinas [(D); 0, 36, 48, 60, 72, 84, 96, and 120 h post NMDA exposure]. (E,F) Number of transgene-positive cells that express PCNA and those that also co-localize with HuC/D as well as the number of HuC/D and PCNA-positive cells in the GCL of NMDA-exposed Tg[atoh7:GFP]rw021(E) and Tg[ptf1a:EGFP]jh1 zebrafish retinas (F). Mean ± SE, n ≥ 9. (G) Single confocal z-stack images of Tg[thrb:tomato]q22 retinas (Gb,c) at 120 h post NMDA exposure labeled for Zpr-1 (Ga), PCNA (Gd), and DAPI (Gc,d). Arrows, Zpr-1 and thrb:tomato-double positive cells in the rod photoreceptor cell nuclear layer. Scale bar, 10 μm (Ga). (H) Number of Zpr-1-positive cells, thrb:Tomato-positive cells, those that co-labeled with PCNA or those triple-positive for thrb:Tomato, PCNA and Zpr-1 in the rod ONL of NMDA-exposed retinas. Mean ± SE, n ≥ 8, *pTukey < 0.05, #p < 0.05, +p < 0.05, and °p < 0.05 indicate comparisons to 0 h post NMDA for the different measures that were assessed. The symbols are color-coded accordingto the line that they represent in the corresponding graphs (pANOVA, see Table 1).

Acknowledgments
This image is the copyrighted work of the attributed author or publisher, and ZFIN has permission only to display this image to its users. Additional permissions should be obtained from the applicable author or publisher of the image. Full text @ Front Cell Dev Biol