
- Title
-
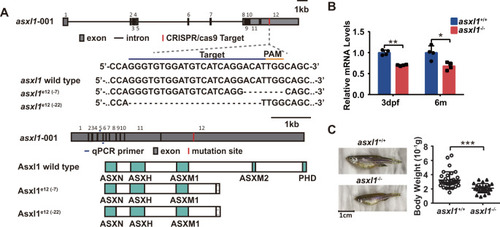
Asxl1 C-terminal mutation perturbs neutrophil differentiation in zebrafish
- Authors
- Fang, X., Xu, S., Zhang, Y., Xu, J., Huang, Z., Liu, W., Wang, S., Yen, K., Zhang, W.
- Source
- Full text @ Leukemia
EXPRESSION / LABELING:
PHENOTYPE:
|

EXPRESSION / LABELING:
PHENOTYPE:
|

|
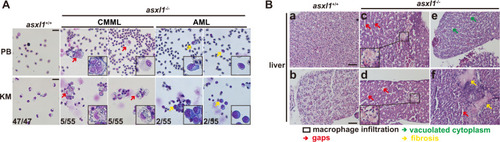
PHENOTYPE:
|

|

EXPRESSION / LABELING:
PHENOTYPE:
|

|
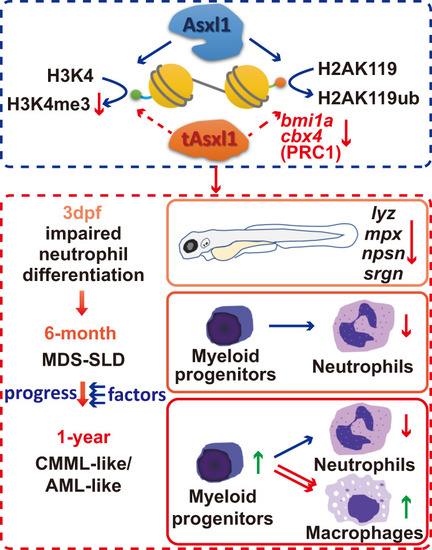
In our model, C-terminally truncated with |

ZFIN is incorporating published figure images and captions as part of an ongoing project. Figures from some publications have not yet been curated, or are not available for display because of copyright restrictions. |