Experimental setup, visual stimulation protocol, and regression-based identification of responsive neurons. a H2B-GCaMP6s fluorescence maximum intensity projection of the CNS of a 5-dpf larva. Scale bar, 200 μm. b Schematic of two-photon microscope used for imaging zebrafish larva brain combined with visual stimulation. Stimuli are presented dorso-frontally using LEDs of four different wavelengths. GM, galvanometric mirror; FF, fluorescence filter; DM, dichroic mirrors. Obj, Olympus × 20, 0.95NA, water immersion; L1, L2, L3, and L4 are the LEDs used for visual stimulation. c Normalized absorption spectra of zebrafish cones (solid lines, modified from Guggiana-Nilo and Engert [10]) overlapped with the LEDs emission spectra (dashed lines) used for visual stimulation. d Protocol of visual stimulation. e GCaMP fluorescence of a selected plane of a 5-dpf larva viewed dorsally (left image) and corresponding segmentation image (right image). Each identified neuron is labeled with a distinct arbitrary color. The dotted orange squares show the area magnified in the right panels, displaying cellular resolution of imaging (top) and segmented neurons (bottom). The inset in the bottom panel shows a neuron selected for the examples in fh. Scale bar, 100 μm. f Fluorescence intensity F(t) measured in the 13-pixel cluster attributed to the selected cell highlighted in e (F0 is shown with the red line; see the “Methods” section for the detailed description of F0 and ΔF/F0 calculation). Stimulus time points are shown at the top. g ΔF/F0 trace. h Fitted regression data (colored trace) and corresponding T values. ik Examples of ΔF/F0 traces and calculated T values obtained from the regression analysis on other neurons demonstrating the responsiveness to the different stimuli

T distributions for stimulated and control larvae at 3 and 5 dpf and spectral identity. Normalized distributions of T values for L1, L2, L3, and L4 stimulation (magenta, green, blue, and red traces, respectively; see legend) and control acquired in the absence of visual stimulation (black trace) measured for 3-dpf larvae (a) and 5-dpf larvae (b). N = 7 larvae for stimulated data; N = 5 larvae for control data in both panels; it should be noted that statistics reported in the figure are cumulated over the total number of ROIs segmented over all larvae for each condition: 847,068 (3 dpf stimulated); 588,198 (3 dpf control); 845,070 (5 dpf stimulated); 518,409 (5 dpf control). c Example traces of neurons with spectrally selective responses under standard (top panels) and shuffled (bottom panels) protocol of visual stimulation. The left panels show ΔF/F0 traces of three neurons with a selective L1 response; the right ones show three neurons with selective L4 responses. Stimulus time points are shown at the top (thicker lines highlight the stimulus eliciting the selective response)

Stimulus-induced neuronal activity: spectral and anatomical mapping. a Heatmap of 600 ROIs ranked by T4D values in a 5-dpf larva. The bar on the left shows T4D values (mapped with the T color scale shown on the right of the panel). The main panel shows ΔF/F0 calcium responses of the 600 neurons (mapped with the ΔF/F0 color scale shown on the right of the panel). Stimulus time points are indicated in their respective colors above the panel. The spectral identity column (next to the heatmap) indicates the spectral identity of each neuron as determined by the threshold analysis: magenta, green, blue, and red lines indicate neurons responsive to L1, L2, L3, and L4 stimuli, respectively; black indicates no response to the visual stimulus. The anatomy column shows the localization of each of the 600 neurons (T, telencephalon; E, eyes; D, diencephalon; M, mesencephalon; R, rhombencephalon; S, spinal cord). Scale bar, 190 μm. b Anatomical map of neurons selected above the T4D threshold (yellow dots) for 7 larvae at 5 dpf registered onto a reference brain (outlines of the anatomical regions mentioned above are displayed in light yellow). c Quantification of spectral and anatomical identities (N = 7 larvae). The top bar graph shows the normalized distribution of all responsive neurons above the T4D threshold across the four spectral stimuli (with their respective color code). The bottom bar graph quantifies the anatomical distribution of the neurons across the CNS areas with the following color coding from top to bottom: dark blue, telencephalon; light blue, eye; turquoise, diencephalon; green, mesencephalon; orange, rhombencephalon; and yellow, spinal cord. The same data with standard errors are shown in Additional file 3:Fig. S3

Spectrally tuned responses and anatomical distributions. ΔF/F0 heatmaps, spectral identity, and anatomical distributions of neurons selected for spectrally tuned responses above the threshold for UV (ac), violet (df), blue (gi), and red (jl) stimuli. See Fig. 3 for the general panel description. a, d, g, j Data from the same 5-dpf larva used for Fig. 3 but with neurons ranked based on L1, L2, L3, and L4 responses, respectively, as shown by the leftmost column. Data from all seven 5 dpf larvae, displaying neurons that passed selection criteria (threshold and peak analysis) for on L1 (b, c), L2 (e, f), L3 (h, i), and L4 (k, l) responses, respectively. Anatomical distributions of all responsive neurons (b, e, h, k), preferred response wavelength, and anatomy are shown (c, f, i, l). Scale bar, 190 μm

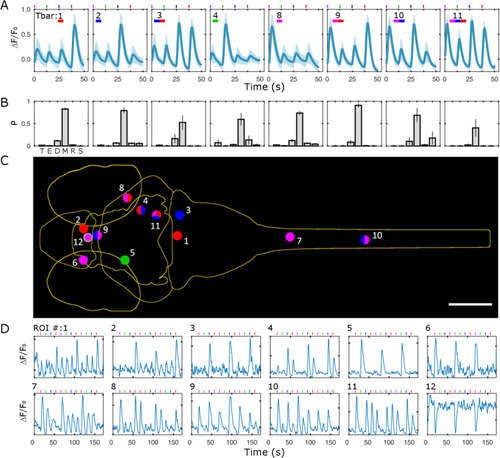
Unique spectral classification with Tbar. a Average ΔF/F0 traces (blue line, mean; light blue area, standard deviation) for all neurons identified in seven 5-dpf larvae with the given Tbar (indicated in each panel). Number of neurons: 2243 (Tbar 1), 581 (Tbar 2), 49 (Tbar 3), 51 (Tbar 4), 4509 (Tbar 8), 308 (Tbar 9), 88 (Tbar 10), and 14 (Tbar 11). The experimental trace of each neuron was first averaged over the three repetitions of the L1/L2/L3/L4 stimuli before averaging among different neurons. Standard deviations were calculated over all data (made of the three repetitions for each neuron, over all neurons found in each class for the seven larvae tested). Colored tick marks above each graph show the timing of the different stimuli. Only the classes with a total numerical consistency above 10 neurons are shown in the figure. b Anatomical distributions of neurons for each Tbar class. Anatomical areas are classified and indicated as in the rest of the paper: Telencephalon (T), eye (E), diencephalon (D), mesencephalon (M), rhombencephalon (R), and spinal cord (S). Values shown are averages and stderr calculated over the seven normalized distributions measured with the 7 larvae for each Tbar. The bars for the last plot (Tbar 11) do not add to 1 because the distributions were normalized to 1 for each larva across the anatomical areas, but not all larvae tested actually contributed cells to this Tbar class (i.e., some larvae contributed 0 into averaging). c Anatomical localization of some example neurons for each of the Tbar classes shown in the previous panels. Each neuron is shown as a dot (not drawn to scale, for visibility) and colored according to its responses with the color coding used throughout the paper. The gray border around neuron #12 indicates a negative T value. Scale bar, 150 μm. d Experimental ΔF/F0 traces for the neurons shown in c. The scales were chosen to optimize visibility in each graph and are not shown for compactness of the figure; the two ticks shown on the vertical axis are as follows for each panel starting from top left: (− 0.5, 2.2), (− 0.3, 1.2), (− 0.3, 1.4), (− 0.6, 4.3), (− 0.5, 3.7), (− 0.3, 1.4), (− 0.6, 2.1), (− 0.5, 3.0), (− 0.3, 1.3), (− 0.4, 3.4), (− 0.5, 4.0), and (− 0.4, 0.2)

CNS spectral and anatomical mapping in 3-dpf larvae. a ΔF/F0 responses of 600 ROIs ranked by T4D values in a 3-dpf larva. Each row in the heatmap represents a neuron. The left bar indicates neurons’ T4D values (T color scale is displayed on the right of the panel). Stimulus time points are indicated at the top of the panel highlighted in their respective colors. The spectral column on the right shows the spectral responses of the neurons selected above the threshold and peak analysis (highlighted in magenta, green, blue, and red for the response to L1, L2, L3, and L4 stimulus, respectively). The anatomical column shows the localization of each ROI across the CNS regions (T, telencephalon; E, eyes; D, diencephalon; M, mesencephalon; R, rhombencephalon; S, spinal cord). b Anatomical map of neurons selected above the T4D threshold (yellow dots) for 7 larvae at 3 dpf registered onto a reference brain for anatomical localization (light yellow outlines). Scale bar, 150 μm. c Quantification of spectral and anatomical identities (N = 7 larvae). The histogram on the top shows the normalized distribution of all responsive neurons above the TTh4D threshold across the four spectral stimuli (displayed in their respective color codes). The histograms on the bottom quantify the anatomical distributions of the neurons above TTh4D (yellow histogram), TThU (magenta), and TThR threshold (red) (from top to bottom) across the CNS areas abovementioned. Error bars = stderr, N = 7

Acknowledgments
This image is the copyrighted work of the attributed author or publisher, and ZFIN has permission only to display this image to its users. Additional permissions should be obtained from the applicable author or publisher of the image. Full text @ BMC Biol.