
- Title
-
Ppargc1a Controls Ciliated Cell Development by Regulating Prostaglandin Biosynthesis
- Authors
- Chambers, J.M., Addiego, A., Flores-Mireles, A.L., Wingert, R.A.
- Source
- Full text @ Cell Rep.
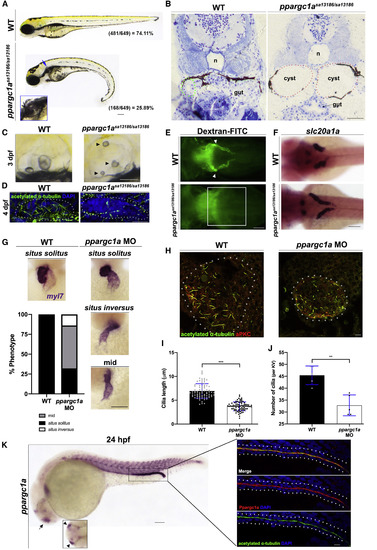
ppargc1a-Deficient Zebrafish Display Phenotypes Commonly Associated with Cilia Defects (A) WT sibling (top) and a ppargc1asa13186/sa13186 mutant (bottom) zebrafish with a curly tail, pronephric cyst (blue arrow, inset), and pericardial edema at 3 dpf. Heterozygous crosses resulted in the expected Mendelian ratio shown at the bottom right of the respective panels (WT group includes homozygous WT and ppargc1a+/sa13186 combined). Scale bar, 90 μm. (B) JB4 transverse section of a 4 dpf WT sibling (left) and ppargc1asa13186/sa13186 mutant (right) zebrafish (n, notochord; tubule outlined in green, cysts outlined in red). Scale bar, 90 μm. (C) Three days post-fertilization WT sibling (left) and ppargc1asa13186/sa13186 mutant (right) otoliths. Arrowheads indicate abnormal otoliths present in the mutant. Scale bar, 90 μm. (D) Four days post-fertilization otic cilia (green, acetylated α-tubulin) of the cristae in WT (left) and ppargc1asa13186/sa13186 mutant (right) zebrafish. Scale bar, 10 μm. (E) Dorsal view of 3 dpf WT sibling (top) and ppargc1asa13186/sa13186 mutant (bottom) approximately 24 h after being injected with 40 kDa dextran-FITC to assay for pronephric function. White arrowheads indicate PCT fluorescence in WT. White box highlights the approximate area of the PCT with no fluorescence. Scale bar, 90 μm. (F) Three days post-fertilization WT sibling (top) and ppargc1asa13186/sa13186 mutant (bottom) stained via WISH for slc20a1a to mark PCT. Scale bar, 90 μm. (G) Fifty-five hours post-fertilization WT and ppargc1a MO injected zebrafish stained via WISH for the heart marker myl7. Penetrance graph of atypical heart looping occurring in WT and ppargc1a morphants. Chi-square analysis indicates significance. n = 128 (WT), n = 103 (MO), p < 0.001. Scale bar, 90 μm. (H) Whole-mount immunofluorescence of the Kupffer’s vesicle (KV) at the 10 ss stained for acetylated α-tubulin (cilia, green), anti-PKC (membrane boundary, red). Scale bar, 8 μm. (I) Cilia length in micrometers of KV cilia. (J) The number of cilia present in the KV. (K) Twenty-four hours post-fertilization WT zebrafish stained via WISH to illustrate ppargc1a mRNA expression. Box is of approximate area of inset showing Ppargc1a (red) expression and the cilia marker acetylated α-tubulin (green). Scale bars, 65 μm for the whole embryo and 10 μm for the inset. Data are represented as mean ± SD; ∗∗p < 0.01 and ∗∗∗p < 0.001 (t test). EXPRESSION / LABELING:
PHENOTYPE:
|

Loss of ppargc1a Results in Ciliogenesis Defects (A) Schematic indicating location of MCCs in the proximal portion and monociliated cells in the distal portion of the zebrafish pronephros at 24 hpf. (B) WT (top) and ppargc1asa13186/sa13186 mutant (bottom) zebrafish at 24 hpf stained via WISH for odf3b to mark MCCs. Scale bar, 90 μm. (C) Graph representing the number of MCCs present in WT and ppargc1asa13186/sa13186 zebrafish at 24 hpf. (D) Fluorescent in situ hybridization for MCC marker (odf3b, green) and transporter cell marker (trpm7, red) in WT and ppargc1a morphant zebrafish at 24 hpf. Scale bar, 10 μm. (E and F) Graphs representing the percentage of odf3b+ (E) or trpm7+ (F) cells in WT (black) and ppargc1a morphants (white) pronephros between somites 9 and 11. (G) Twenty-eight hours post-fertilization WT (top), ppargc1a MO-injected (middle), and ppargc1asa13186/sa13186 (bottom) zebrafish stained via whole-mount immunofluorescence for acetylated α-tubulin (cilia, green), γ-tubulin (basal bodies, red), and DAPI in the proximal pronephros. Scale bar, 10 μm. (H) Cilia length in micrometers for the proximal pronephros. (I) Graph of the percentage of ciliated basal bodies/total basal bodies per 100 μm in the proximal pronephros. (J) Twenty-eight hours post-fertilization WT (top) and ppargc1a MO-injected (middle) and ppargc1asa13186/sa13186 (bottom) zebrafish stained via whole-mount immunofluorescence for acetylated α-tubulin (cilia, green), γ-tubulin (basal bodies, red), and DAPI in the distal pronephros. Scale bar, 10 μm. (K) Cilia length in micrometers for the distal (right) pronephros. (L) Graph of the percentage of ciliated basal bodies/total basal bodies per 100 μm in the distal pronephros. (M and N) Fluorescent intensity plots of WT (black) and ppargc1a MO-injected (red) zebrafish in proximal (M) and distal (N) pronephros. Data are represented as mean ± SD. ∗p < 0.05, ∗∗p < 0.01, and ∗∗∗p < 0.001 (one-way ANOVA or t test). |

ppargc1a Loss of Function Phenotypes Can Be Rescued by Supplementing with PGE2 (A) Relative concentration of PGE2 in WT and ppargc1a morphants. (B) MCCs stained via WISH for odf3b at 24 hpf in WT (left), ppargc1a MO (middle), and ppargc1a morphants treated with dmPGE2 (right). Scale bar, 90 μm. (C) Graph depicting the number of MCCs present in WT, ppargc1a MO, and ppargc1a MO treated with dmPGE2. (D) Twenty-eight hours post-fertilization WT (top), ppargc1a MO-injected (middle), and ppargc1a MO-injected + dmPGE2 (bottom) zebrafish stained via whole-mount immunofluorescence for acetylated α-tubulin (cilia, green), γ-tubulin (basal bodies, red), and DAPI in the proximal pronephros. Scale bar, 10 μm. (E) Cilia length in micrometers for the proximal pronephros of WT, ppargc1a morphants, and ppargc1a morphants treated with dmPGE2. (F) Graph of the percentage of ciliated basal bodies/total basal bodies per 100 μm in the proximal pronephros. (G) Twenty-eight hours post-fertilization WT (top), ppargc1a MO-injected (middle), and ppargc1a MO-injected + dmPGE2 (bottom) zebrafish stained via whole-mount immunofluorescence for acetylated α-tubulin (cilia, green), γ-tubulin (basal bodies, red), and DAPI in the distal pronephros. Scale bar, 10 μm. (H) Cilia length in micrometers for the distal pronephros of WT, ppargc1a morphants, and ppargc1a morphants treated with dmPGE2. (I) Graph of the percentage of ciliated basal bodies/total basal bodies per 100 μm in the distal pronephros. (J and K) Scatterplots illustrating the difference in fluorescent intensity signals of WT, ppargc1a MO, and ppargc1a MO + dmPGE2 in proximal (J) and distal (K) cilia. (L) Representative images of ppargc1a+/sa13186 in crosses shown at 48 hpf WT zebrafish treated with DMSO (top), curly ppargc1asa13186/sa13186 treated with DMSO (middle), and a WT-appearing, genotype-confirmed ppargc1asa13186/sa13186 rescued with dmPGE2 (bottom). Scale bar, 90 μm. (M) The percentage of zebrafish with WT (black) or curly (white) phenotypes at 48 hpf after treatment with DMSO or dmPGE2. Chi-square test indicates significance. Data are represented as mean ± SD. ∗p < 0.05, ∗∗p < 0.01, and ∗∗∗p < 0.001 (one-way ANOVA or t test); n.s., not significant. |

ppargc1a and Prostaglandin Pathway Component ptgs1 Act Together to Properly Form Ciliated Cells
(A) Twenty-eight hours post-fertilization WT (top), ppargc1a suboptimal dose MO (SMO), ptgs1 SMO, ppargc1a + ptgs1 SMO, and ppargc1a + ptgs1 SMO + dmPGE2-treated zebrafish stained via whole-mount immunofluorescence for acetylated α-tubulin (cilia, green), γ-tubulin (basal bodies, red), and DAPI in the proximal pronephros. Scale bar, 7 μm. (B) Cilia length in micrometers for the proximal pronephros. (C) Graph of the percentage of ciliated basal bodies/total basal bodies per 100 μm in the proximal pronephros. (D) Twenty-eight hours post-fertilization WT (top), ppargc1a SMO, ptgs1 SMO, ppargc1a + ptgs1 SMO, and ppargc1a + ptgs1 SMO + dmPGE2-treated zebrafish stained via whole-mount immunofluorescence for acetylated α-tubulin (cilia, green), γ-tubulin (basal bodies, red), and DAPI in the distal pronephros. Scale bar, 7 μm. (E) Cilia length in micrometers for the distal pronephros. (F) Graph of the percentage of ciliated basal bodies/total basal bodies per 100 μm in the distal pronephros. (G) MCCs stained via WISH for odf3b at 24 hpf in WT, ppargc1a SMO, ptgs1 SMO, ppargc1a + ptgs1 SMO, and ppargc1a + ptgs1 SMO + dmPGE2-treated zebrafish. Scale bar, 50 μm. (H) Graph depicting the number of MCCs present. (I) Forty-eight hours post-fertilization zebrafish injected with ppargc1a SMO, ptgs1 SMO, ppargc1a + ptgs1 SMO, and ppargc1a + ptgs1 SMO + dmPGE2-treated displaying either a WT phenotype (left) or an affected phenotype (right). The respective penetrance is listed within each image area. Scale bar, 100 μm. Data are represented as mean ± SD. ∗p < 0.05, ∗∗p < 0.01, and ∗∗∗p < 0.001 (one-way ANOVA); n.s., not significant. |

ptgs1 Functions Downstream of ppargc1a during Ciliogenesis
(A) Schematic depicting several Ppargc1a consensus sites located within 1.5 kb of the ptgs1 open reading frame (ORF). (B) Twenty-four hours post-fertilization WT (top) and ppargc1asa13186/sa13186 (bottom) zebrafish stained via WISH for ptgs1 (n > 60). Scale bar, 100 μm. (C) Relative ptgs1 mRNA expression in WT and ppargc1a morphants. (D) Whole-mount immunofluorescence for acetylated α-tubulin (cilia, green), γ-tubulin (basal bodies, red), and DAPI in the proximal pronephros of WT (top), ppargc1a morphants (middle), and ppargc1a morphants injected with ptgs1 cRNA (bottom). Scale bar, 7 μm. (E) Cilia length for the proximal pronephros treatment groups shown in (D). (F) Graph of the percentage of ciliated basal bodies/total basal bodies per 100 μm in the proximal pronephros. (G) Whole-mount immunofluorescence for acetylated α-tubulin (cilia, green), γ-tubulin (basal bodies, red), and DAPI in the distal pronephros of WT (top), ppargc1a morphants (middle), and ppargc1a morphants injected with ptgs1 cRNA (bottom). Scale bar, 7 μm. (H) Cilia length for distal pronephros treatment groups shown in (G). (I) Graph of the percentage of ciliated basal bodies/total basal bodies per 100 μm in the distal pronephros. (J) WISH for the MCC marker odf3b in WT (top), ppargc1a morphants, and ppargc1a morphants injected with ptgs1 cRNA (bottom). Scale bar, 90 μm. (K) Number of MCCs per nephron. (L) Proposed mechanism by which ppargc1a regulates MCC development and ciliogenesis via PGE2 levels by controlling ptgs1 expression. Data are represented as mean ± SD. ∗p < 0.05, ∗∗p < 0.01, and ∗∗∗p < 0.001 (one-way ANOVA or t test); n.s., not significant. |