
- Title
-
Lamellipodia-like protrusions and focal adhesions contribute to collective cell migration in zebrafish
- Authors
- Olson, H.M., Nechiporuk, A.V.
- Source
- Full text @ Dev. Biol.
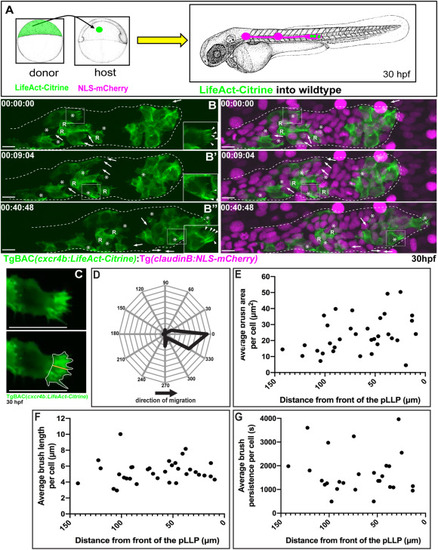
Fig. 1. Dynamic behavior of brush-like protrusions during pLLP migration. (A) Schematic of the approach used to create mosaic embryos. Cells from TgBAC(cxcr4b:LifeAct-Citrine) embryos were transplanted into embryos positive for Tg(claudinB:NLS-mCherry). (B) Lateral view of stills from a mosaic pLLP imaged at 30 hpf (Movie 1). Insets show brush-like protrusions at 1.5X.(C) Schematic of protrusion parameter measurements: the yellow line and white outline indicate brush length and area, respectively. (D) Orientation of brush-like protrusions in regards to the direction of migration. (E) Average brush area per cell plotted as a function of the location of the cell within the pLLP (0 μm – caudal pLLP tip). (F) Average brush length per cell plotted as a function of the location of the cell within the pLLP. (G) Average brush persistence per cell plotted as a function of the location of the cell within the pLLP. (D–G) Protrusion parameters were measured from 27 to 34 cells in 15–17 chimeric embryos. Brush-like protrusions (asterisk) were defined as those containing ≥2 actin cables (arrowheads). Filopodial protrusions are marked by arrows. Scale bar = 10 μm. R = cells incorporated into rosettes. |

Fig. 2. Arp2/3 activity is required for brush-like protrusion formation and pLLP migration. (A) Effects of increasing concentration of CK-666 on pLLP migration in comparison to vehicle and inactive control drug, CK-689. (B) Mosaically labeled embryos carrying TgBAC(cxcr4b:LifeAct-Citrine) transgene were first exposed to DMSO (vehicle) and imaged for 1.5 h beginning at 30 hpf (Movie 2). (C) Following DMSO treatment, embryos were then exposed to the Arp2/3 inhibitor CK-666 for 4 h and concurrently imaged (Movie 2). Note the loss of brush-like protrusions following the treatment. Images show lateral views. (B′,C′) 1.8X zoom of boxed cells in B and C. (D) Percentage of time a given cell contained a brush-like protrusion during vehicle and the inhibitor treatment (n = 11 cells from 6 embryos). (E) Migration speed of the whole pLLP during vehicle and inhibitor treatment (n = 8 whole pLLPs). Asterisks = brush-like protrusions. Scale bar = 10 μm. |
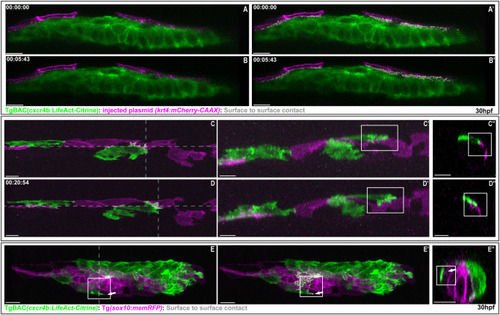
Fig. 3. Lamellipodia-like protrusions interact with membranes of skin and pLLP cells. (A,B) Basal layer epidermal cells were mosaically labeled by injection of krt4:mCherry-CAAX plasmid in a TgBAC(cxcr4b:LifeAct-Citrine) embryo and imaged between 28 and 32 hpf (Movie 4). Panels A and B show top-down view of the pLLP. Live movies were processed in Imaris to generate a 3D surface rendering for each channel. Gray color in A′ and B′ indicates contact between the protrusions and the membranes (magenta). Note that pLLP cells make direct contact with the overlying skin cells. (C–E) Donor cells derived from TgBAC(cxcr4b:LifeAct-Citrine) and Tg (sox10:memRFP) (magenta) were transplanted into non-transgenic embryos and mounted for live imaging between 30 and 36 hpf (Movie 5). Panels C and D show lateral views. Panels C′ and D′ show digitally rotated top-down view from C and D (horizontal dashed line). C″ and D″ panels show a digitally rotated coronal section through the pLLP in C and D (vertical dashed lines). Surface-to-surface contact shown in gray. Note the close proximity of the green protrusion to the magenta membrane (boxes in C′, C″, D′, and D″). Panel E shows contact of a cell, incorporated into rosette, with another cell in front (box). Panel E′ shows surface-to-surface contact rendering of cells in the region. Panel E″ show a digitally rotated coronal section through the dashed line in E. Note the close proximity of the protrusion to the membrane of a neighboring cell (arrow). Scale bar = 10 μm. |
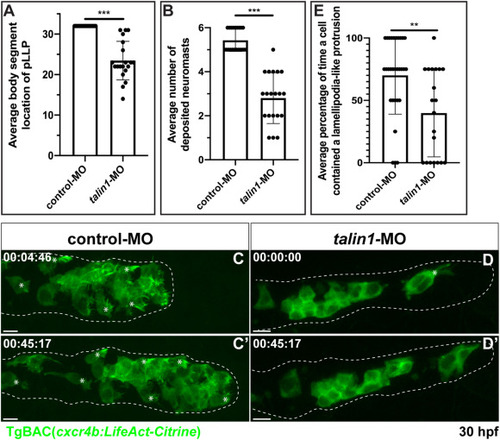
Fig. 4. Talin1 is necessary for proper lamellipodia-like protrusion formation. (A) Average body segment location of the pLLP 48 hpf in control (0.5 ng) compared to talin1 morpholino (0.5 ng) injected embryos carrying the TgBAC(cxcr4b:LifeAct-Citrine) transgene (n = 20 embryos for each condition). (B) Average number of neuromasts deposited 48 hpf in control-MO and talin-1 MO injected embryos carrying the TgBAC(cxcr4b:LifeAct-Citrine) transgene (n = 20 embryos for each condition). (C and D) Mosaic pLLPs containing cells from TgBAC(cxcr4b:LifeAct-Citrine)-positive embryos that were injected with either 0.5 ng of a control or 0.5 ng of talin1 MOs. Embryos were imaged laterally between 28 and 32 hpf to visualize lamellipodia-like protrusions (Movie 6). (E) Average percentage of time a cell contained a lamellipodia-like protrusion in the control mosaic embryos compared to the talin1 morpholino mosaic embryos. Note that the average percentage of time a cell contained a lamellipodia like protrusion was reduced following Talin1-deficient pLLP cells. Control MO: n = 30 cells from 10 embryos; talin1 MO: n = 20 cells from 8 embryos. Asterisks = lamellipodia-like protrusions. Scale bar = 10 μm. |
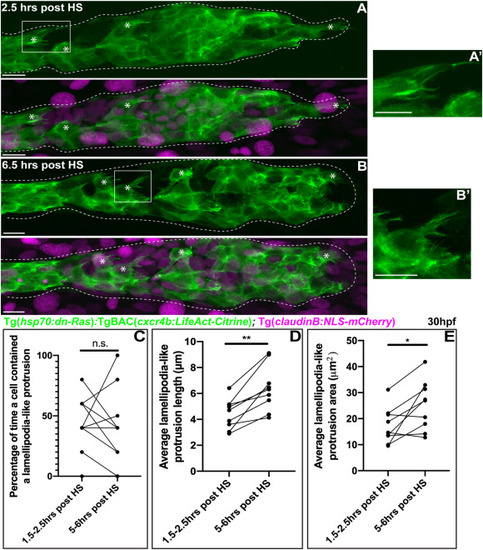
Fig. 5. Disruption of Ras signaling impairs lamellipodia-like protrusion formation. (A, B) Lateral views of mosaic embryo carrying the Tg (hsp70:dN-Ras); TgBAC(cxcr4b:LifeAct-Citrine) cells. Embryos were heat shocked at 28 hpf, allowed to recover for 1h, and then mounted for live imaging (Movie 7). (A′,B′) 2X magnified images of boxed cells. Note abnormal spikey lamellipodia-like protrusions. (C) Percentage of time a cell contained a lamellipodia-like protrusion comparing early (1.5–2.5 h) post heat shock to late post heat shock (5–6 h) stages (n = 12 cells from 4 embryos). (D and E) Average lamellipodia-like protrusion length and size per cell comparing early (1.5–2.5 h) to late post heat shock (5–6 h) stages (n = 9 cells from 4 embryos). Asterisks = lamellipodia-like protrusions. Scale bar = 10 μm. |
Reprinted from Developmental Biology, 469, Olson, H.M., Nechiporuk, A.V., Lamellipodia-like protrusions and focal adhesions contribute to collective cell migration in zebrafish, 125-134, Copyright (2020) with permission from Elsevier. Full text @ Dev. Biol.