FIGURE SUMMARY
Title

Cadherins regulate nuclear topography and function of developing ocular motor circuitry

Authors
Knüfer, A., Diana, G., Walsh, G.S., Clarke, J.D., Guthrie, S.
Source
Full text @ Elife

Differential expression of cadherins in ocular motor neurons in <italic>Isl1:GFP</italic> at 48 hpf.

(A, E) Dorsal views of ocular motor neurons (green) and detection of mRNA expression (magenta) of negative control dapB. (B–D, F–H) Expression of type II cadherins cdh7a and cdh11 and atypical cadherin cdh13 (magenta) in ocular motor neurons (green). Dorsal views show cadherin expression in surrounding tissue and masked by GFP-positive area. Outlines indicate locations of nIII and nIV. White and blue arrows indicate high and low expression, respectively. All images represent snapshots of 3D Imaris visualisations of entire z-stacks. Scale bars (A, C–E) = 20 μm. (B–D) Dorsal views of ocular motor neurons and cadherin expression in surrounding tissue and masked by GFP-positive area. (F–H) Transverse views of ocular motor neurons and masked cadherin expression by GFP-positive area.

Detection of <italic>foxg1a</italic> mRNA expression at 48 hpf.

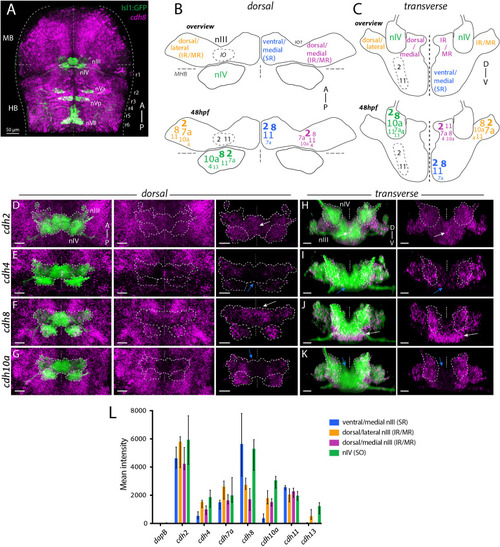
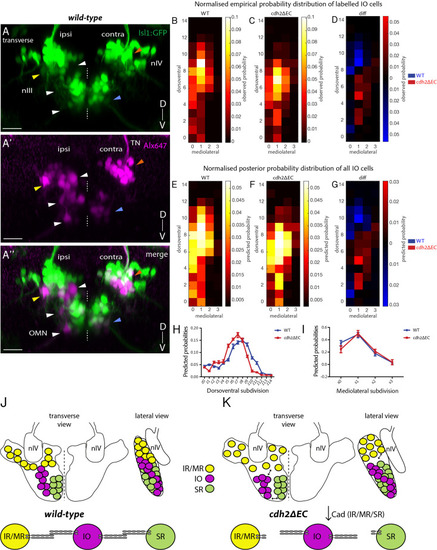
Dorsal view of ocular motor neurons (green) in Tg(Isl1:GFP) embryo at 48 hpf and foxg1a mRNA expression (magenta, positive control). Image represents a snapshot of 3D Imaris visualisation of entire z-stack.

Differential expression of cadherin combinations in ocular motor neurons in <italic>Isl1:GFP</italic> at 72 hpf.

(A–B) Summary schematics of combinatorial cadherin expression in nIII and nIV neurons based on anatomical location. Font sizes indicate varying expression levels according to the median value of mean fluorescence intensities (in arbitrary units, a.u.) displayed in (D): small (500–1500 a.u.), regular (1500–2500 a.u.), large (2500–3500 a.u.) and large and bold font size (3500+ a.u.). Mean intensities below 500 a.u are omitted. Views represent flattened dorsal and transverse projections. IR, inferior rectus; MR, medial rectus; SR, superior rectus; IO, inferior oblique. (C–P) Expression of type I cadherins cdh2 and cdh4, type II cadherins cdh7a, cdh8, cdh10a and cdh11 and atypical cadherin cdh13 (magenta) in ocular motor neurons (green) and surrounding tissue. Outlines indicate locations of nIII and nIV. White and blue arrows indicate high and low expression, respectively. All images represent snapshots of 3D Imaris visualisations of entire z-stacks. Scale bars = 20 μm. (C–I) Dorsal views of ocular motor neurons and cadherin expression in surrounding tissue and masked by GFP-positive area. (J–P) Transverse views of ocular motor neurons and masked cadherin expression by GFP-positive area. (Q) Corrected mean fluorescence intensities of cadherin expression in nIII and nIV neurons in a.u., detected using RNAscope in situ hybridisation. Data represents median and interquartile range, n = 5 measurements from n = 3 embryos, from three different clutches.

Ocular motor nuclei of <italic>cdh2ΔEC</italic> larvae retain key characteristics of dorsoventral organisation but appear disorganised compared to wild types.

(A, B) Dorsal views of the entire z-stack for representative wild-type Isl1:GFP and cdh2ΔEC larvae at 72 hpf. Example embryo in (B) is the same as shown in Figure 2D. (A’-A’’’’’; B’–B’’’’’) Sub-stack projections of three combined dorsoventral (DV) subdivisions (z0–z14) moving from dorsal to ventral for wild-type Isl1:GFP (A–A’’’’’) and cdh2ΔEC (B–B’’’’’) larvae. All images are maximum intensity projections of confocal z-stacks. nIII: rostral to MHB; nIV: caudal to MHB. Arrows indicate differences in clustering of dorsal neurons and less organised ventral population in the case of cdh2ΔEC larvae. MHB: midbrain-hindbrain boundary, mid: midline. Scale bars = 20 μm.

Contralateral migration of ventral SR neurons is abolished in <italic>cdh2ΔEC</italic> fish.

(A) Dorsal view schematic of contralateral migration phases. Dotted lines and arrows indicate the midline and direction of migration, lines represent leading processes. (B) Transverse view projection of an Isl1:GFP embryo immunostained against GFP. TN, trochlear nerve. Scale bars = 20 μm. (C–D) Dorsal view maximum intensity projections of ventral half of wild-type Isl1:GFP and cdh2ΔEC embryos immunostained against GFP and RFP at 50 hpf. Dotted lines represent the midline. (E–F) Single sagittal confocal sections of nIII GFP fluorescence at the midline in wild-type and cdh2ΔEC fish. Scale bars = 20 μm. (G) Area of GFP fluorescence measured in sagittal sections of nIII. Error bars represent median and range, n = 7 (wild-type) from two clutches and n = 14 from two clutches (cdh2ΔEC), *p=0.0125. There was no difference in the number of nIII cells (medians for wild types (n = 4)=95 and cdh2ΔEC (n = 9)=103, p=0.414). Both tests are two-tailed Mann-Whitney U. (H) Labelling of ocular motor subnuclei by retro-orbital dye fill. MHB, midbrain-hindbrain boundary. (I–J’) Ventral view maximum intensity projections of DiI-filled ventral nIII neurons in Isl1:GFP and cdh2ΔEC larvae at 5 dpf. Scale bars = 20 μm. White arrows indicate neurons which have crossed to the contralateral side, asterisks represent mCherry+ signal. (K–L’’) Dorsal view maximum intensity projections of sparsely labelled neurons located in ventral nIII in Isl1:GFP and cdh2ΔEC larvae at 5 dpf. White and blue arrows indicate GFP-positive and GFP-negative dye-filled neurons. The left eye is the side of dye fill. Alx647 = AlexaFluor 647 dye. Scale bars = 20 μm. Note that in K-K’’, small magenta puncta represent non-specific dye spread, while in K-K’’ these likely also include punctate mCherry signal from cdh2ΔEC expression, due to spectral overlap. (M) Total observed number of pooled dye-filled cells belonging to each category in wild types and cdh2ΔEC at 5 dpf. There is a significant relationship between genotype and distribution of dye-filled neurons, (p<0.0001; chi squared test). There was no significant effect of genotype on the total number of dye-filled neurons across groups per larva, medians for wild types = 31, cdh2ΔEC = 40.5, p=0.674, 2-tailed Mann-Whitney U. Wild-type larvae are from four clutches and cdh2ΔEC larvae are from five clutches. (N–Q) Percentage proportions of dye-filled neurons per larva for each genotype separated by category. All tests are two-tailed Mann-Whitney U. (N) Percentage proportions of contralateral GFP-positive SR cells. n = 15 larvae (wild-type) and n = 16 (cdh2ΔEC) larvae, **p=0.0015. (O) Percentage proportions of ipsilateral GFP+ cells. n = 15 larvae (wild-type) and n = 16 (cdh2ΔEC) larvae, *p=0.0109. (P) Percentage proportions of ipsilateral GFP negative IO cells. n = 15 larvae (wild-type) and n = 16 (cdh2ΔEC) larvae, p=0.5131. (Q) Percentage proportions of contralateral nIV cells. n = 19 larvae (wild-type) and n = 20 (cdh2ΔEC) larvae, p=0.9391. (N–P) Proportions are relative to the total number of nIII cells filled per larva, for (Q) proportions are relative to combined total of dye-filled nIII and nIV neurons. Larvae in which less than 10 nIII cells were filled in total were excluded from analysis in (N–P), whereas larvae in which less than 10 combined nIII and nIV cells were filled in total were excluded from analysis in (Q).

<italic>cdh2ΔEC</italic> expression results in mispositioning of zebrafish trochlear neurons along the dorsoventral axis.

(A–B) Lateral view maximum intensity projections of nIII and nIV of wild-type Isl1:GFP and cdh2ΔEC larvae at 72 hpf. Dotted lines represent the midbrain-hindbrain boundary. OMN, oculomotor nerve; TN, trochlear nerve. (C) Measurements of dorsoventral extent of nIV at 72 hpf. Dots represent individual larvae. Error bars represent median and range. n = 14 larvae from two clutches for each genotype, **p=0.0042, two-tailed Mann-Whitney U. Larvae were mounted laterally to align both eyes prior to imaging. Where necessary, images were resampled to align bilateral ocular motor nuclei to the same plane and oriented so that the edge of the neuropil was directly parallel to the anterior-posterior axis.

Non-<italic>cdh2ΔEC</italic> expressing zebrafish inferior oblique neurons are mispositioned following perturbation of cadherin function in neighbouring oculomotor subnuclei.

(A–A’’) Transverse maximum intensity projection of a wild-type Isl1:GFP larva at 5 dpf in which nIII and nIV neurons have been labelled using retro-orbital dye fills with Alexa647 dextrans. Ipsi denotes side of dye fill. White and yellow arrows indicate ipsilateral GFP-negative IO neurons and ipsilateral GFP-positive neurons (IR/MR). Blue and orange arrows indicate contralateral GFP-positive SR neurons and SO (nIV) neurons. OMN, oculomotor nerve; TN, trochlear nerve. Scale bars = 20 μm. (B–C) Normalised empirical and posterior (E–F) probability distribution of IO neuron spatial locations in wild types (278 cells, n = 19 larvae, four clutches) and cdh2ΔEC (399 cells, n = 22 larvae, five clutches) according to dorsoventral (DV; from z0 (ventral) to z14 (dorsal)) and mediolateral (ML; from x0 (medial) to x3 (lateral)) subdivisions. (D) Normalised empirical and posterior (G) differential probability distribution of IO neuron spatial locations between genotypes. diff = cdh2ΔEC distribution – wild-type distribution. There are differences in the overall spatial distribution between genotypes (KLmean = 0.3114, 95% CI [0.3107 0.3122]). (H–I) Median posterior probabilities of IO cell location within DV (H) and ML (I) subdivisions for wild types and cdh2ΔEC larvae. There is a difference in DV (z-shift = 0.5201, 95% CI [0.5168 0.5234]) and ML distribution (x-shift = −0.1423, 95% CI [−0.1431–0.1414]) between genotypes. (J–K) Diagrammatic representation of transverse and lateral views of IO ocular motor neuron location in wild types and cdh2ΔEC. Perturbation of cadherin binding between cdh2ΔEC-expressing IR/MR and SR subnuclei and wild-type IO neurons leads to a ventral and lateral shift in IO neuron location.

Perturbation of cadherin function does not disrupt zebrafish extraocular neuromuscular junction formation.

(A–H’’) Immunostained NMJs composed of presynaptic vesicles (SV2) and acetylcholine receptors (α-bungarotoxin) in wild-type (A–D’’) and cdh2ΔEC (E–H’’) larvae at superior rectus (SR), inferior rectus (IR), inferior oblique (IO) and superior oblique (SO) extraocular muscles at 4 dpf. Scale bars = 20 μm. All images are maximum intensity projections of sub-stacks taken from larger z-stacks. (I) Area of SV2+ signal and colocalisation coefficient of SV2 and α-bungarotoxin (J) of NMJs of each individual extraocular muscle. There was no significant difference in the area of SV2 (SR, p=0.9880; MR, p=0.9391; IR, p=0.9880; IO, p=0.9880; SO, p=0.9751; multiple t-tests, and Holm-Sidak test) or colocalisation of SV2 (SR, p=0.9288; MR, p=0.9288; IR, p=0.9212; IO, p=0.9288; SO, p=0.9534) and α-bungarotoxin for any muscle between wild types (n = 7 for MR, IO, SO; n = 6 for SR and IR; from two clutches) and isl1:cdh2ΔEC-mCherry (n = 7 for SR, MR, IR, IO; n = 6 for SO; from two clutches). Error bars are mean and SD.

<italic>cdh2ΔEC</italic> larvae display impaired efficiency of nasal eye movements and defects in eye range.

(A–A’) Example OKR video still illustrating coordinated nasal (right eye) and temporal (left eye) eye movements. (B) Ocular motor circuitry of underlying the OKR of larval zebrafish. Nasal and temporal eye movements are driven by medial and lateral rectus-innervating motor neurons of distinct nuclei. (C–D) Average nasal (C) and temporal (D) eye gain of wild types and cdh2ΔEC larvae averaged for all trials. There is a significant difference in nasal eye gain for the strong (p=0.0003) and weak eye (p=0.0472). There was no significant difference in temporal eye gain for the strong (p=0.0597) or weak eye (p=0.2574). (E) Total eye range for strong and weak eyes for each genotype. There was a significant difference for the strong (p<0.0001) and weak eye (p=0.0011). (C–E) All tests are t-test with Welch’s corrections. Error bars are mean and SD. Both wild type and cdh2ΔEC larvae are from two clutches.

Acknowledgments
This image is the copyrighted work of the attributed author or publisher, and ZFIN has permission only to display this image to its users. Additional permissions should be obtained from the applicable author or publisher of the image. Full text @ Elife