FIGURE SUMMARY
Title

Mitochondrial Calcium Uniporter (MCU) deficiency reveals an alternate path for Ca2+ uptake in photoreceptor mitochondria

Authors
Bisbach, C.M., Hutto, R.A., Poria, D., Cleghorn, W.M., Abbas, F., Vinberg, F., Kefalov, V.J., Hurley, J.B., Brockerhoff, S.E.
Source
Full text @ Sci. Rep.

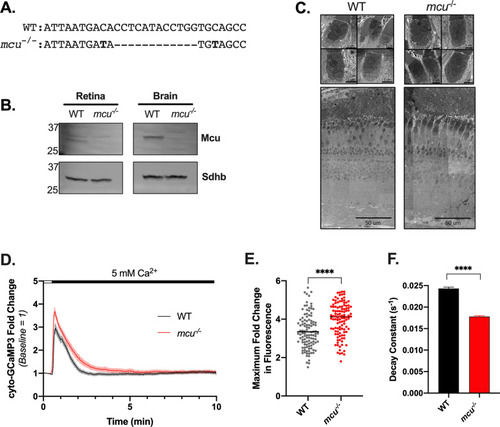
Mcu contributes to clearance of cytosolic Ca2+ in zebrafish cones. (A) Alignment of a portion of exon 5 of zebrafish mcu showing WT (top) and CRISPR-generated mcu-/- (mcuw249; bottom). (B) Western blot showing Mcu expression in retina and brain from global mcu-/- zebrafish. 20 µg of protein from mitochondrial lysate from 6 pooled retinas and 1 brain was analyzed. The custom Mcu antibody detects a faint non-specific band at a slightly higher molecular weight than Mcu. (C) Scanning electron microscopy (SEM) images of WT and mcu-/- zebrafish cone mitochondria (top panel) and retinas (bottom panel) from 11-month old sibling fish. Retinal and mitochondrial morphology appear unchanged by loss of Mcu (n = 8 retinas from WT and mcu/- zebrafish were examined, representative images from 1 WT and 1 mcu-/- retina are shown). (D) Traces of relative cyto-GCaMP3 fluorescence of cone cell bodies in adult retinal slices of WT or mcu-/- fish expressing gnat2:cyto-GCaMP3. Baseline mitochondrial fluorescence was determined in KRB buffer containing 0 mM CaCl2 and 0.4 mM EGTA, then a bolus of CaCl2 was delivered in order to bring the [Ca2+]free to 5 mM. The mean is reported and shaded region = 95% CI. (n = 110 cells (four fish) for WT and n = 112 cells (four fish) for mcu-/-). (E) Maximum fold change in cyto-GCaMP3 fluorescence for each cell body after exposure to 5 mM [Ca2+]free. WT: 3.345 ± 0.085, mcu-/-: 3.985 ± 0.082, mean ± SEM reported, p < 0.0001 using Welch’s t test. (n = 110 cells (from four fish) for WT and n = 112 cells (from four fish) for mcu-/-). (F) Decay constants calculated using a single exponential decay fit. WT: 0.02433 s−1 (0.02384 to 0.02483), mcu-/-: 0.01781 s−1 (0.01743 to 0.01821), decay constant with 95% CI reported, p < 0.0001 using Welch’s t test.

Mitochondrial Ca2+ uptake in cones from global mcu-/- zebrafish is diminished, but not ablated. (A) Total cone mitochondrial fluorescence in gnat2:mito-GCaMP3 larval zebrafish eyes. The mean is reported with bars indicating standard error. (n = 8 WT fish, 4 mcu+/- fish, and 5 mcu-/- fish. ns = not significant using one-way ANOVA with Tukey’s multiple comparisons test). (B) Relative mito-GCaMP3 fluorescence of cone mitochondrial clusters in adult retinal slices of WT or mcu-/- fish expressing gnat2:mito-GCaMP3. Baseline mitochondrial fluorescence was determined in KRB buffer containing 2 mM CaCl2, then ionomycin (5 µM) was added to allow 2 mM Ca2+ entry into the mitochondria to saturate the probe. Next, EGTA (5 mM) was added to the solution (holding 5 µM ionomycin constant) to chelate Ca2+ and determine minimum mito-GCaMP3 fluorescence. The mean is reported and shaded region = 95% CI. (n = 55 mitochondrial clusters (three fish) for WT and n = 51 mitochondrial clusters (three fish) for mcu-/-). (C) Fold change in baseline mito-GCaMP3 fluorescence relative to WT average. The median is reported with bars indicating interquartile range. (ns = not significant using Mann–Whitney test). (D) gnat2:mito-GCaMP3 retina slices preincubated with 100 µM KB-R7943 (10 min prior to imaging and white bar) then subjected to 25 µM sildenafil (black bar). For Ru360 treatment, retinal slices were preincubated for 1 h in 10 µM Ru360 and then the same experiment was performed in the presence of 10 µM Ru360. The mean response of all mitochondrial clusters is reported with the dark trace, while the semi-transparent traces show the responses of each individual mitochondrial cluster. The dotted line indicates 1.2-fold above baseline. (Mitochondrial clusters from n = 86 WT, n = 64 mcu-/-, n = 86 WT + Ru360, and n = 85 mcu-/- + Ru360 cells are reported. All conditions were tested in multiple slices from n = 3 fish each). (E) The percent of mitochondrial clusters from each condition which responded or did not respond to sildenafil. Mitochondrial clusters which exhibited an increase in mito-GCaMP3 fluorescence of 1.2-fold or greater above baseline at any time after sildenafil treatment are considered to have responded. (n = 86 WT, n = 64 mcu-/-, n = 86 WT + Ru360, and n = 85 mcu-/- + Ru360). (F) The maximum fold change in mito-GCaMP3 fluorescence at any time during imaging. Mitochondrial clusters which did not respond to sildenafil are excluded. (n = 80 WT, n = 38 mcu-/-, n = 31 WT + Ru360, n = 40 mcu-/- + Ru360). (G) The time at which each mitochondrial cluster first increased mito-GCaMP3 fluorescence 1.2-fold above baseline. (n = 80 WT, n = 38 mcu-/-, n = 31 WT + Ru360, n = 40 mcu-/- + Ru360).

Retinas from global mcu-/- zebrafish have normal morphology, metabolism, and photoresponse. (A) Total TCA cycle metabolite levels in mcu-/- zebrafish retinas relative to WT. Zebrafish were dark-adapted for 18 h and retinas were dissected under red light. α-ketoglutarate levels trend higher in mcu-/- zebrafish retinas, although they are not significantly different than WT (1.4 ± 0.5-fold higher in mcu-/- retinas, p = 0.09 using Welch’s t test, mean ± standard deviation is reported, n = 6 WT and 6 mcu-/- retinas from 3 different fish each). (B) P-Pdh and total Pdh immunoblot from dark-adapted WT and global mcu-/- zebrafish retinas. 15 µg of protein was loaded in each lane. Quantification of the P-Pdh/Pdh ratio of each sample relative to the average WT P-Pdh/Pdh ratio is shown below each lane (n = 4 WT and 4 mcu-/- retinas from 4 different fish each). (C) Ex vivo ERG a-wave responses from WT and mcu-/- zebrafish retinas. Cone responses were isolated using DL-AP4 (40 µM) and CNQX (40 µM) and normalized to Rmax (the maximum response at the brightest light intensity). Bright flash stimulus intensity is 3,650,000 photons µm−2 and 2–23 ms in duration. The mean is reported and the shaded region indicates standard error (n = 21 retinas from 12 WT fish and 21 retinas from 13 global mcu-/- fish). (D) Ex vivo ERG a-wave responses from WT and mcu-/- zebrafish retinas under dim flash stimulus under the same conditions as (C). (E) a-wave response amplitude data plotted as a function of stimulus intensity (photons μm-2) of WT and global mcu-/- retinas from experiments shown in (C) and (D) (Bars indicate standard error). (F) Normalized response amplitude data for experiments shown in (C) and (D) indicate that sensitivity is not changed in global mcu-/- cones (Bars indicate standard error).

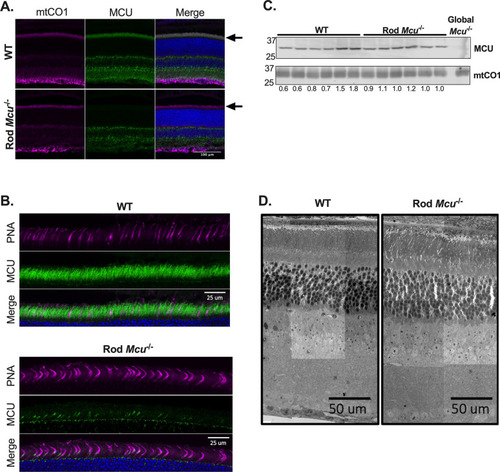
Rods express low levels of MCU. (A) Immunohistochemistry showing MCU expression in WT and Rod Mcu-/- retinas. mtCO1 (Mitochondrial Cytochrome Oxidase subunit 1) is used to label mitochondria. An arrow indicates the photoreceptor mitochondria layer. (B) Immunohistochemistry showing MCU expression and PNA-647 (staining cone outer segments). MCU is still expressed in cones from Rod Mcu-/- retinas. (C) Western blot showing MCU expression in whole retinas from Rod Mcu-/- mouse. 15 µg of retinal protein lysate was loaded in each lane. MCU expression is not significantly altered in Rod Mcu-/- retinas (1.02 ± 0.03 fold higher in Rod Mcu-/- retinas, mean ± standard deviation is reported, ns using Welch’s t test). Retinal lysate from a global Mcu-/- mouse is used as a control to show specificity of MCU antibody (far right lane). The MCU/mtCO1 ratio for each sample relative to WT average is shown under each lane (n = 6 WT and 6 Rod Mcu-/- retinas from 3 animals each). (D) SEM images from 6-month old WT and Rod Mcu-/- retinas (retinas from n = 3 mice were imaged, representative images from 1 WT and 1 Rod Mcu-/- retina shown).

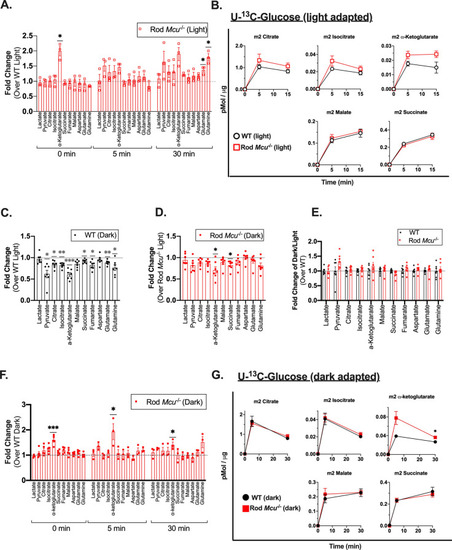
Loss of MCU leads to a buildup of α-ketoglutarate in Rod Mcu-/- retinas. (A) Total metabolite levels in light-adapted Rod Mcu-/- retinas relative to WT (n = 3 WT and 3 Rod Mcu-/- retinas per time point. Each time point used retinas from 3 different animals (*indicates p < 0.05 using Welch’s t test). (B) Time course of labeled metabolite accumulation in light-adapted WT and Rod Mcu-/- retinas incubated in U-13C-glucose for 0, 5, and 15 min (n = 3 WT and 3 Rod Mcu-/- retinas per time point. Each time point used retinas from 3 different mice. (C) Total metabolite levels in dark-adapted WT retinas relative to light-adapted WT retinas (n = 4 light adapted retinas and 7 dark adapted retinas, each from four different mice. *indicates p < 0.05, **indicates p < 0.01, ***indicates p < 0.001 using Welch’s t test). (D) Total metabolite levels in dark-adapted Rod Mcu-/- retinas relative to light-adapted Rod Mcu-/- retinas (n = 6 light adapted retinas and 7 dark adapted retinas, each from four different mice. * indicates p < 0.05 using Welch’s t test). (E) Change in metabolite abundance between darkness and light in Rod Mcu-/- retinas relative to WT retinas from Fig. 4C, D. (n = 4 light adapted WT retinas, 7 dark adapted WT retinas, 6 light-adapted Rod Mcu-/- retinas, and 7 light-adapted Rod Mcu-/- retinas, all ns using Welch’s t test). (F) Total metabolite levels in dark-adapted Rod Mcu-/- retinas relative to WT (n = 4 WT and 5 Rod Mcu-/-retinas for t = 0, n = 3 WT and 3 Rod Mcu-/- retinas for t = 5 and t = 30. Each time point used retinas from at least 3 different animals. *indicates p < 0.05, *** indicates p < 0.001 using Welch’s t test). (G) Time course of dark-adapted WT and Rod Mcu-/- retinas incubated in U-13C-glucose for 0, 5, and 30 min (n = 3 WT and 3 Rod Mcu-/- retinas per time point. Each time point used retinas from 3 different animals. *indicates p < 0.05 using Welch’s t test).

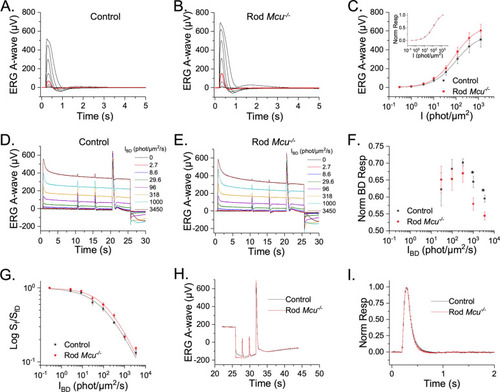
Mouse rods lacking Ca2+ uptake through MCU exhibit normal photoresponse. (A, B) Flash response families of dark adapted iCre+ (control; A) and Mcuf/f iCre+ (Rod Mcu-/-; B) mice from transretinal ERG recordings. Scotopic a-wave responses were recorded by a series of test flashes (1 ms in duration) with intensities (in photons/µm2) 0.3, 1, 3.5, 10.2 (red traces), 35.4, 117, 385, 1270. (C) Averaged rod responses (Mean ± SEM) from control (black) and Rod Mcu-/- mice (red) plotted as a function of flash intensity show only a marginal (p > 0.05) difference in the response amplitude between these groups (n = 10 for each). The solid lines represent curves fitted to the intensity response using the Naka–Rushton Function, R/Rmax = I/(I + I1/2). (Inset) Normalized intensity response curves showing no difference in sensitivity between control (black) and Rod Mcu-/- (red) mice. (D, E) ERG responses to steps of incremental background illumination of control (D) and Rod Mcu-/- mice (E) with subsequent responses to dim and saturating light flashes (n = 8 for each). (F) The background light response at plateau, normalized to the peak of the initial background response, as a function of background light intensity. The plateau response for the two brightest backgrounds was significantly lower for the Rod Mcu-/- responses compared to these from controls (n = 8 for each). (G) Light-adapted sensitivity, normalized to the corresponding dark-adapted value, plotted as a function of background light intensity. Solid lines represent curves fitted to the response plots using the Weber Fechner function. (n = 8 for each). (H) Rod sensitivity during subsequent dark adaptation was estimated from ERG responses to dim flashes recorded at 2 s and 4 s after turning off a step of background light; averaged traces for control (black; n = 8) and Rod Mcu-/- (red; n = 12) retinas are shown. No notable differences in the kinetics of the dim flash response between control and Mcu-/- rods at both 2 s and 4 s time points for the two brightest background steps (1000 and 3450 photons/μm2/s) were evident. (I) A representative plot for the flash responses recorded at 4 s after turning off the highest background (3450 photons/μm2/s) shows identical kinetics between control (n = 8) and Rod Mcu-/- (n = 12) responses.

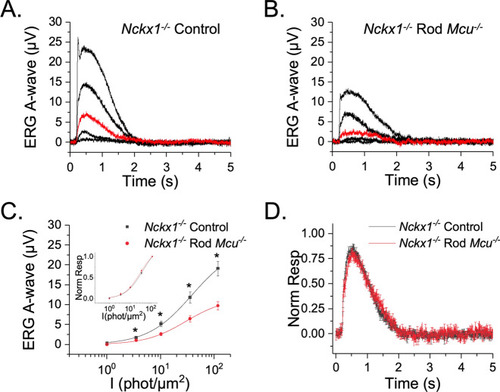
MCU-mediated mitochondrial Ca2+ uptake does not modulate the photoresponses in Nckx1-/- mice. (A, B) Flash response families of dark adapted Nckx1-/- iCre+ (Nckx1-/- control; A) and Nckx1-/-Mcuf/f iCre+ double knockout (Nckx1-/- Rod Mcu-/-; B) mice from transretinal ERG recordings. Scotopic a-wave responses were recorded by a series of test flashes (1 ms in duration) with intensities (in photons/µm2) 1, 3.5, 10.2 (red traces), 35.4, 117. (C) Averaged rod responses (Mean ± SEM) from Nckx1-/- control (black; n = 10) and Nckx1-/- Rod Mcu-/- mice (red; n = 9) plotted as a function of flash intensity show a substantial reduction of the response amplitude in the double knockouts as compared to the controls. However, the sensitivity of the rods (estimated their normalized intensity response functions; Inset) remained unchanged between Nckx1-/- control (black) and Nckx1-/- Rod Mcu-/- (red) mice. (D) The kinetics of the dim flash response were not affected in the Nckx1-/- Rod Mcu-/- mice (n = 9); red trace) as compared to Nckx1-/- controls (n = 10; black trace).

Acknowledgments
This image is the copyrighted work of the attributed author or publisher, and ZFIN has permission only to display this image to its users. Additional permissions should be obtained from the applicable author or publisher of the image. Full text @ Sci. Rep.