
- Title
-
Vitamin E is necessary for zebrafish nervous system development
- Authors
- Head, B., La Du, J., Tanguay, R.L., Kioussi, C., Traber, M.G.
- Source
- Full text @ Sci. Rep.
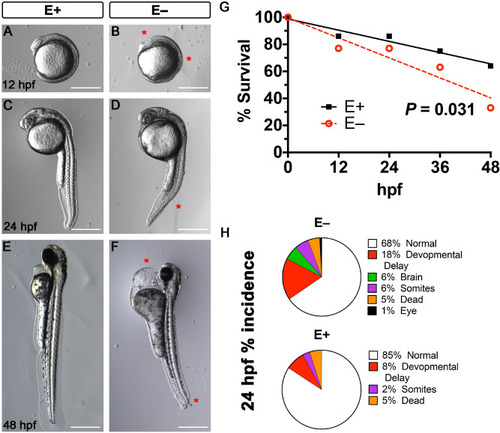
Morphological abnormalities associated with VitE deficiency at 12-, 24- and 48 h post-fertilization. Representative bright field images of E+ and E− embryos showed normal development in E+ embryos and abnormalities in the E− embryos. At 12 hpf, E+ embryos ( PHENOTYPE:
|
|
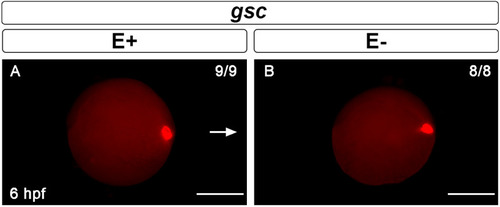
Gastrulation marker goosecoid ( EXPRESSION / LABELING:
|
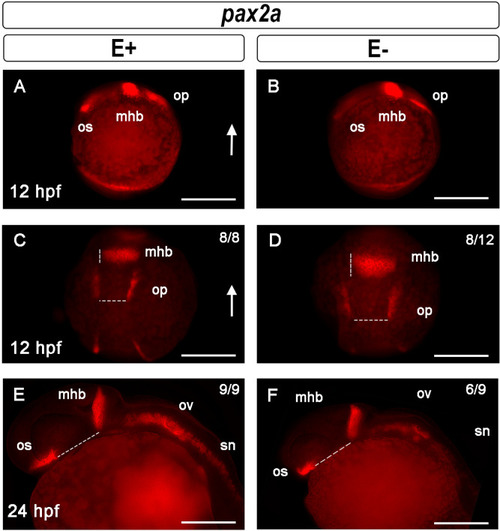
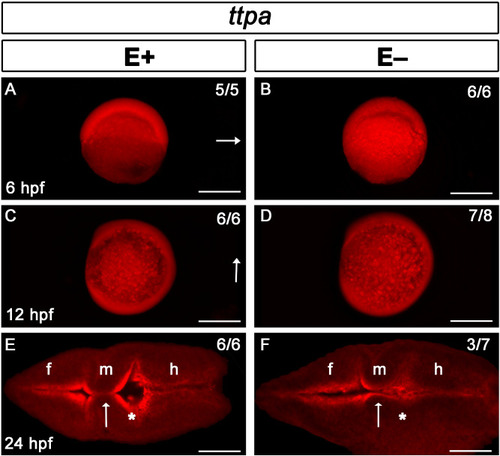
Midbrain-hindbrain boundary formation shown by EXPRESSION / LABELING:
PHENOTYPE:
|
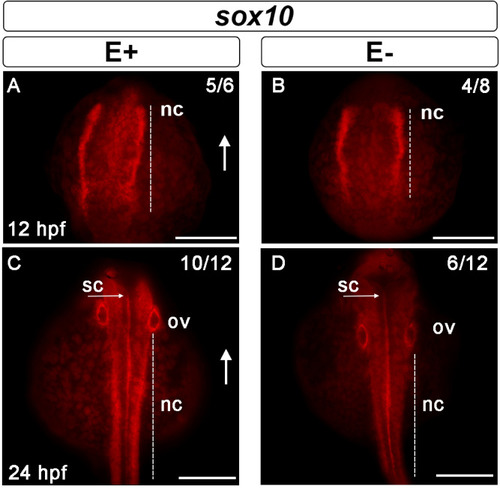
Neural crest cell migration impaired during development by VitE deficiency. S EXPRESSION / LABELING:
PHENOTYPE:
|
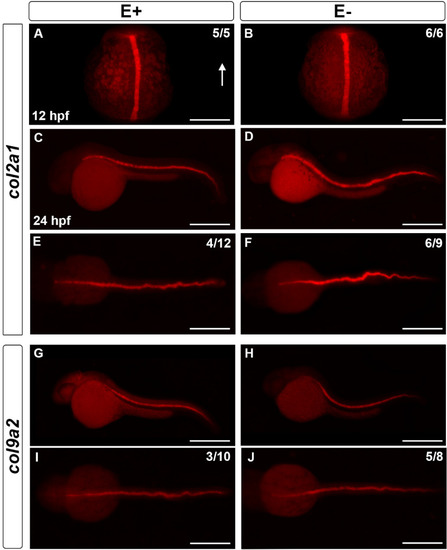
Notochord collagen markers EXPRESSION / LABELING:
PHENOTYPE:
|

Relative gene expression of neurogenesis markers. Log2 fold change of genes measured in E− relative to E+ by RT-qPCR. |

Histological analysis of 24 hpf zebrafish embryos with morphological defects associated with VitE status. Hematoxylin and eosin staining of E+ and E− embryos at 24 hpf was used to evaluate morphological defects, including fore- (F) and mid- (M), and hind- (H) brain ventricle inflation, somite formation and notochord vacuolation. Transverse section of E+ embryos had tear-drop shaped-F with eyes to each side ( PHENOTYPE:
|