
- Title
-
Targeting the histone demethylase PHF8-mediated PKCα-Src-PTEN axis in HER2-negative gastric cancer
- Authors
- Tseng, L.L., Cheng, H.H., Yeh, T.S., Huang, S.C., Syu, Y.Y., Chuu, C.P., Yuh, C.H., Kung, H.J., Wang, W.C.
- Source
- Full text @ Proc. Natl. Acad. Sci. USA
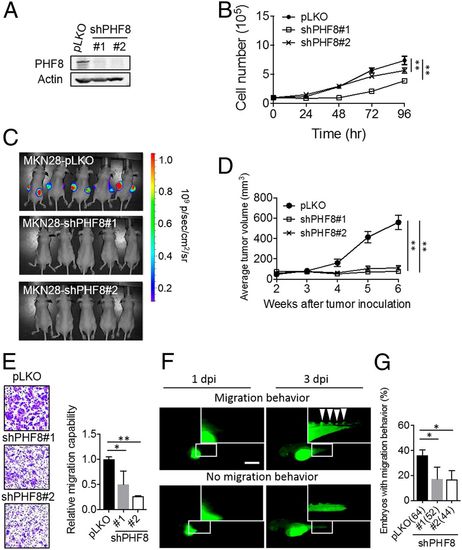
PHF8 is crucial for MKN28 cell proliferation and migration in vitro and in vivo. (A) Analysis of PHF8 in MKN28 infected with lentivirus carrying control pLKO or shPHF8 constructs (#1 or #2), followed by puromycin selection. PHF8 expression was analyzed by Western blotting. Actin was the internal control. (B) The depletion of PHF8 exhibited a reduced degree of cell proliferation in MKN28. (C and D) Luciferase-expressing MKN28 cells (pLKO [n = 5], shPHF8#1 [n = 5], and shPHF8#2 [n = 5]) were grown on nude mice. Images of control and shPHF8 MKN28-luc xenografts were taken after 6 wk of injection (C). Two weeks after implantation, the tumor volumes were measured every week up to 6 wk (D). Data are presented as mean ± SD, with the SD derived from five mice. **P < 0.01 (one-way ANOVA test). (E) The depletion of PHF8 exhibited a reduced degree of cell migration in MKN28 using Transwell cell migration assay. (F and G) Zebrafish migration assays. MKN28 labeled with CFSE (green fluorescence dye) were ectopically injected into the yolk-sac parts of 2-d-old zebrafish embryos. Fluorescence microscopic analysis was conducted at 1 dpi and 3 dpi. Representative fluorescence images of a zebrafish embryo displaying cell dissemination (Upper) or no migration (Lower) at 3 dpi (F). (Scale bar, 100 µm.) The depletion of PHF8 exhibited a significantly reduced proportion of embryos with migration behavior in MKN28 (G). Total number of embryos (pLKO, shPHF8#1, or shPHF8#2) is shown in the bracket. Data were obtained from three independent studies. *P < 0.05 (two-tailed Student’s t test). In B, E, and G data are presented as the average of three replicates ± SD *P < 0.05, **P < 0.01 (two-tailed Student's t test). |

Pharmacological inhibition of PHF8-PKCα-Src-PTEN blocks GC progression in vitro and in vivo. (A) Analysis of PTEN protein level in MKN28 treated with 0, 1, 2, or 4 μM of midostaurin (Mido). (B) Detection of migration activity of MKN28 treated with Mido by using Transwell migration assay. (C) Analysis of PTEN protein level in MKN28 treated with 0, 1, 2, or 4 μM of bosutinib (Bosu). (D) Detection of migration activity of MKN28 treated with Bosu by using Transwell migration assay. In B and D, data are presented as the average of three replicates ± SD **P < 0.01 (two-tailed Student’s t test). (E and F) Zebrafish xenotransplantation assays using Mido or Bosu. MKN28 labeled with CM-Dil (red fluorescence dye in the membrane) were ectopically injected into the yolk-sac parts of 2-d-old Tg(fli1:EGFP) (fish with green fluorescence in blood vessels) zebrafish embryos, followed by immersion in solutions containing 1 μM midostaurin or bosutinib (a sublethal dose) at 1 dpi. Fluorescence microscopic analysis was conducted at 1 dpi and 3 dpi. Representative fluorescence images of a zebrafish embryo displaying cell dissemination (Upper) or no migration (Lower) at 3 dpi (E). Cyan, blood vessel. (Scale bar, 100 µm.) Quantification of embryos with migration behavior in vehicle or drug-treated groups (F). Total number of embryos used in vehicle, Mido, and Bosu is shown in the bracket. Data were obtained from three independent studies. **P < 0.01 (two-tailed Student’s t test). (G) A schematic diagram shows that the PHF8-c-Jun complex contributes to GC progression through activation of PKCα-Src-dependent signaling to suppress PTEN. Targeting the PHF8-c-Jun-PKCα-Src-PTEN axis represents a prognostic/therapeutic target in advanced GC. |

Clinical relevance of PHF8, PKCα, and PTEN in 42 GC subjects obtained from CGMH. (A) Representative image of immunohistochemical profiles. PHF8, PKCα, and PTEN were immunostained for each of gastric tissue specimens (n = 42). (Scale bar, 100 μm.) (B) IRS score of GC samples. (C−E) The correlation of IHC signals for two-group comparisons: PHF8 and PKCα (C), PHF8 and PTEN (D), PKCα and PTEN (E). Statistical significance was evaluated using the χ2 test. (F) PHF8 expression is significantly correlated with tumor stage in patients with GC. Statistical calculation is conducted using one-way ANOVA analysis. (G) Five-year OS and 5-y DFS analysis according to the level of PHF8 and PKCα expression in patients with GC (n = 42). High, IRS ≥ 8; low, IRS ≤ 6. Statistical significance (PHF8highPKCαhigh vs. PHF8lowPKCαlow) was determined by log-rank test. |