
- Title
-
Fibrodysplasia ossificans progressiva mutant ACVR1 signals by multiple modalities in the developing zebrafish
- Authors
- Allen, R.S., Tajer, B., Shore, E.M., Mullins, M.C.
- Source
- Full text @ Elife

(a) Embryos expressing ACVR1 HA-tagged constructs were immunostained for HA at the shield stage (early gastrula); ACVR1 domain schematics of the constructs are above each set of corresponding images. Nuclei (yellow), βcatenin (cyan), ACVR1-HA (magenta). Scale bars = 40 μm. ΔAcvr1 constructs lack residues 35–100, which contain the cysteine-rich ligand binding motifs. Uninjected (N = 6) and embryos injected with: Acvr1 (N = 6), ΔAcvr1 (N = 5), Acvr1-R206H (N = 9), ΔAcvr1-R206H (N = 4), Acvr1-G328R (N = 5), and ΔAcvr1-G328R (N = 5). (b) BMP signaling dose-dependent 12–30 hpf zebrafish embryo phenotypes: severe dorsalization (C5-C4, dark blue), mild dorsalization (C3-C1, light blue), wild-type development (WT, violet), mild ventralization (V1-V3, light orange), and severe ventralization (V4-V5, dark orange). (c) Bubble plot circle sizes correspond to the percent of total embryos within a condition that are in a particular phenotypic category. Examples are shown for: 100%, 90%, 80%, 70%, 60%, 50%, 40%, 30%, 20% and 10%. (d) Representative phenotypes of wild-type embryos (evaluated at 12 and 30 hpf) and embryos injected with acvr1l MO (evaluated at 12 hpf; none survive to 30 hpf). (e–g) DV phenotypes of 12–30 hpf embryos injected with Acvr1 or ΔAcvr1 mRNA alone or together with acvr1l MO. Data are from four pooled experiments. (e) Acvr1 or ΔAcvr1 injected embryos. Columns: 1, N = 240; 2, N = 121; 3, N = 140; 4, N = 153; 5, N = 96; 6, N = 118. (e’) Representative 12 or 30 hpf phenotypes. (f) Acvr1-R206H or ΔAcvr1-R206H injected embryos. Columns: 1, N = 240; 2, N = 70; 3, N = 84; 4, N = 153; 5, N = 73; 6, N = 91. (f’) Representative 30 hpf phenotypes. (g) Acvr1-G328R or ΔAcvr1-G328R injected embryos. Columns: 1, N = 240; 2, N = 88; 3, N = 79; 4, N = 153; 5, N = 78; 6, N = 71. (g’) Representative 30 hpf phenotypes. PHENOTYPE:
|
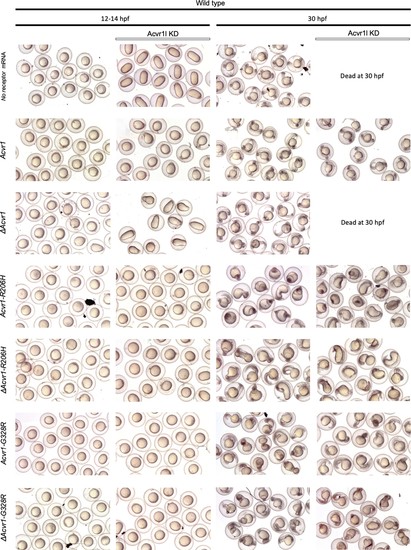
Representative 12–14 and 30 hpf phenotypes of injected embryos. |
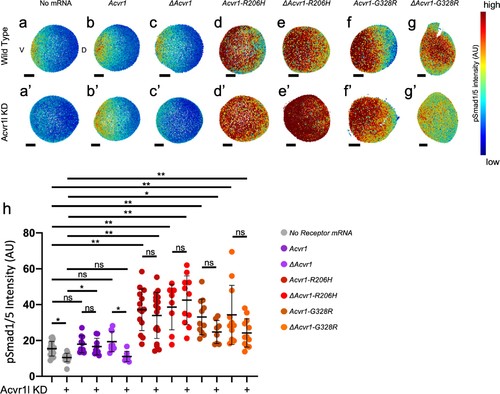
(a,a’–g,g’) Animal pole view of relative pSmad1/5 intensities (using arbitrary units (AU)) within each nucleus of the embryo in representative WT early-gastrula embryos (shield-65% epiboly stage) with endogenous Acvr1l present (a–g) or knocked down (a’–g’). Injected mRNAs are noted above for b-g and b’-g’. (a–c, a’–c’) Embryos are oriented with ventral (V) side to the left and the dorsal (D) side to the right. (d–g, d’–g’) Dorsal side of the embryo could not be identified due to loss of the shield structure with severe ventralization. Scale bars = 100 μm. (a, a’) Wild-type and Acvr1l-KD embryos, respectively (N = 18 and 15). (b, b’) Acvr1 injected embryos (N = 10 and 9). (c, c’) ΔAcvr1 injected embryos (N = 9 and 7). (d, d’) Acvr1-R206H injected embryos (N = 14 and 17). (e, e’) ΔAcvr1-R206H injected embryos (N = 8 and 11). (f, f’) Acvr1-G328R injected embryos (N = 12 and 9). (g, g’) ΔAcvr1-G328R injected embryos (N = 12 and 12). (h) Mean nuclear pSmad1/5 fluorescence of injected embryos. Each dot represents the mean nuclear fluorescence for an individual embryo. Mean and standard deviation of each condition are shown by bars. * indicates p<0.05, ** indicates p<0.001, ns indicates no significance. |

(a) Representative dorsal-ventral (DV) phenotypes of bmp7-/- embryos not injected (12 hpf), injected with bmp7 mRNA (12 and 30 hpf), or bmp7 mRNA and acvr1l KD (12–14 hpf). (b–d) 12–30 hpf DV phenotypes of bmp7-/- embryos with acvr1l KD that were injected with human ACVR1 mRNA alone or combined with bmp7 mRNA. (b) WT ACVR1 injected embryos. Three pooled experiments. Columns: 1, N = 240; 2, N = 150; 3, N = 143; 4, N = 101; 5, N = 120. (b’) Representative 12 and 30 hpf phenotypes. (c) ACVR1-R206H injected embryos. Two pooled experiments. Columns: 1, N = 177; 2, N = 78; 3 N = 132; 4, N = 100; 5, N = 86. (c’) Representative 12 and 30 hpf phenotypes. (d) ACVR1-G328R injected embryos. Two pooled experiments. Columns: 1, N = 52; 2, N = 46; 3, N = 55; 4, N = 56; 5, N = 82. (d’) Representative 12 and 30 hpf phenotypes. (e–f) 12–30 hpf DV phenotypes of bmp7-/- embryos with acvr1l KD that were injected with a mouse Acvr1 or ΔAcvr1 mRNA alone or in combination with bmp7 mRNA. Four pooled experiments. (e) WT Acvr1 or ΔAcvr1 mRNA Columns: 1, N = 540; 2, N = 172; 3, N = 143; 4, N = 152; 5, N = 231; 6, N = 163; 7, N = 104; 8, N = 97; (f) Acvr1-R206H or ΔAcvr1-R206H mRNA Columns: 1, N = 540; 2, N = 172; 3, N = 143; 4, N = 152; 5, N = 176; 6, N = 217; 7, N = 119; 8, N = 145. PHENOTYPE:
|
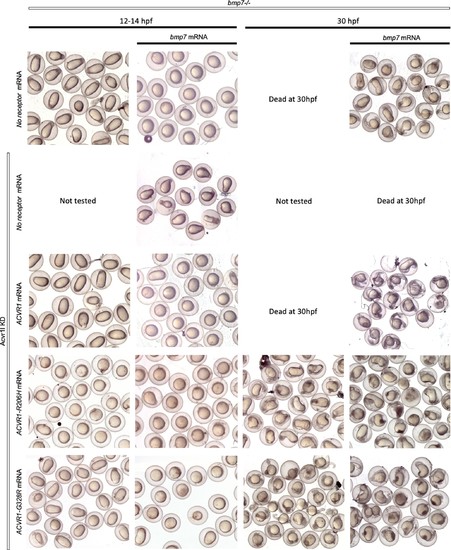
Representative 12–14 and 30 hpf phenotypes of injected embryos. PHENOTYPE:
|

Unlike Acvr1-R206H, neither ΔAcvr1-R206H nor ΔAcvr1 responds to Bmp7 ligand. |
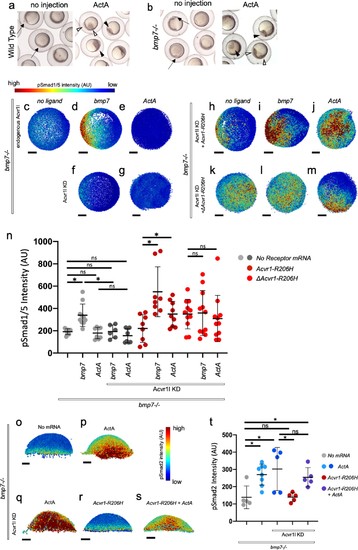
(a, b) Representative 6 hpf (shield stage) WT (a) and bmp7-/- (b) embryos uninjected or injected with Activin A mRNA. WT and bmp7-/- develop normal dorsal organizers (arrows). Activin A injection causes embryos to have expanded (filled arrowheads) or duplicated (empty arrowheads) dorsal organizers. (c–m) Animal pole view of pSmad1/5 intensities (using arbitrary units (AU)) within each nucleus of the embryo in representative bmp7-/- early gastrula (shield stage) embryos with endogenous Acvr1l present (c–e) or knocked down (f–m). Injected receptor mRNA is noted to the left and ligand mRNA is noted above. Embryos are oriented with the dorsal shield to the right. Scale bars = 100 μm. (c–e) bmp7-/- uninjected embryos (N = 8), or injected with bmp7 (N = 10), or Activin A (N = 8) mRNA. (f and g) bmp7-/-, acvr1l KD embryos injected with bmp7 (N = 6) or Activin A (N = 8) mRNA. (h–j) Acvr1-R206H injected bmp7-/-, acvr1l KD embryos with no injected ligand (N = 8), bmp7 (N = 8), or Activin A (N = 9) mRNA. (k–m) ΔAcvr1-R206H injected bmp7-/-, acvr1l KD embryos (N = 11), with injected bmp7 (N = 11), or Activin A (N = 11) mRNA. (n) Mean nuclear pSmad1/5 fluorescence of injected embryos. Each dot represents the mean fluorescence of an individual embryo. Mean and standard deviation of each condition is shown. * indicates p<0.05, ns indicates no significance. (o–s) Lateral views showing relative pSmad2 intensities (using arbitrary units (AU)) within each nucleus of the embryo in representative bmp7-/- early gastrula embryos (shield stage) with endogenous acvr1l present (i and j) or knocked down (k–m). Injected mRNA is noted above each image. Embryos are oriented with the presumptive dorsal side facing forward. Scale bars = 100 μm. (o) bmp7-/- embryo (N = 5) (p) Activin A injected embryo (N = 8) (q) Activin A injected embryo with Acvr1l knockdown (N = 5) (r) mAcvr1-R206H injected embryo with Acvr1l knockdown (N = 5) (s) mAcvr1-R206H and Activin A injected embryo with Acvr1l knockdown (N = 5) (t) Mean nuclear pSmad2 fluorescence of injected embryos. Each dot represents the mean fluorescence of an individual embryo. Mean and standard deviation of each condition is shown by bars. * indicates p<0.05, ns indicates no significance. |
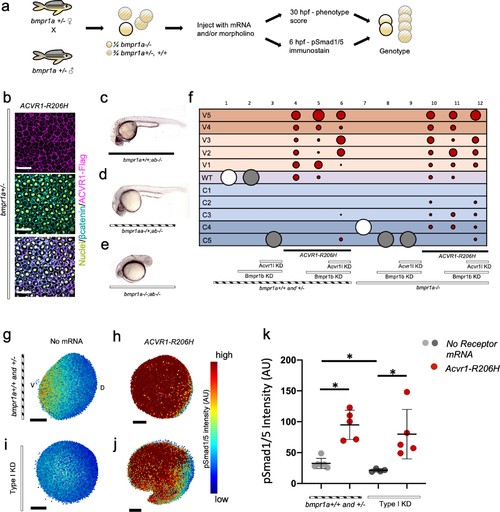
(a) Experimental workflow. bmpr1aa+/-; ab-/- fish were crossed with each other to generate bmpr1a+/- (bmpr1aa+/+; ab-/-), bmpr1a+/- (bmpr1aa+/-; ab-/-), and bmpr1a-/- (bmpr1aa-/-;ab-/-) embryos. One-cell stage eggs were injected with bmpr1ba, bmpr1bb morpholinos, and separately injected with an acvr1l morpholino to additionally knockdown these endogenous BMP receptors, and then were injected with ACVR1-R206H mRNA. Early gastrula (shield-65% epiboly) stage embryos were collected and fixed for immunostaining. At 12 to 30 hpf the remaining embryos were scored for DV patterning phenotypes. Following blindly immunostaining and imaging, or phenotyping, embryos were individually genotyped. (b) Representative immunostained embryo for ACVR1-Flag (magenta), β-Catenin (marking the cell membrane cyan), and nuclei (yellow) (N=5). (c-e) Representative 24 hpf phenotypes of (b) bmpr1aa+/+; ab-/-, (c) bmpr1aa+/-; ab-/-, and (d) bmpr1aa-/-; ab-/- embryos. (f) Injected embryo phenotypes at 12 to 30 hpf. Three pooled experiments. Columns: 1, N=104; 2, N=41; 3, N=69; 4, N=69; 5, N=78; 6, N=70; 7, N=36; 8, N=19; 9, N=25; 10, N=29; 11, N=23; 12, N=22. (g-j) Animal pole view of relative pSmad1/5 intensities (AU) within each nucleus in representative early-gastrula embryos. (d and f) Embryos are oriented with the ventral (V) side to the left and the dorsal (D) side to the right. (e and g) Dorsal side of the embryo could not be identified due to loss of the shield structure with ventralization. (g) bmpr1a+/- embryo (N=5). (h) bmpr1a+/- embryo injected with ACVR1-R206H mRNA (N=5). (i) bmpr1a-/- embryo with acvr1l and bmpr1b KD (Type I KD embryo) (N=4). (j) Type I KD embryo injected with ACVR1-R206H mRNA (N=5). (k) Mean nuclear pSmad1/5 fluorescence of injected embryos. Each dot represents the mean fluorescence of an individual embryo. Mean and standard deviation of each condition (e-h) is shown. * indicates P<0.05, ns indicates no significance. |
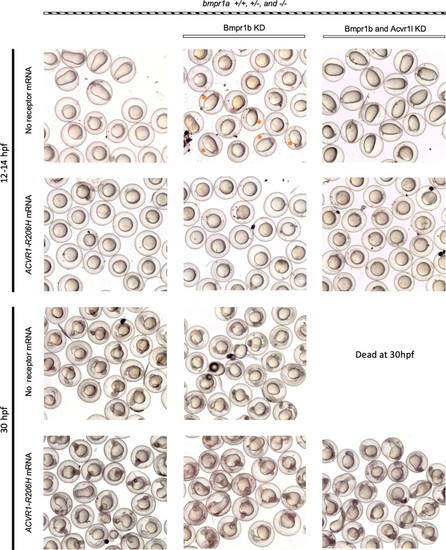
Representative 12 and 30 hpf phenotypes of injected embryos. Dead C5 embryos were removed from 30 hpf live embryos prior to photographing. Orange asterisks indicate C5 bmpr1a-/- embryo with bmpr1b KD; indicating that loss of all Bmpr1 function eliminates BMP signaling. |

Top bubble plots are from two pooled experiments. Columns: 1, N = 24; 2, N = 76; 3, N = 101; 4, N = 66; 5, N = 72; 6, N = 59; 7, N = 36; 8, N = 28; 9, N = 32; 10, N = 20; 11, N = 30; 12, N = 13. Lower panels are injected embryo phenotypes at 14 to 30 hpf. 14–16 hpf C5 embryos are in the process of lysing. Dead C5 embryos were removed from 30 hpf live embryos prior to photographing. |
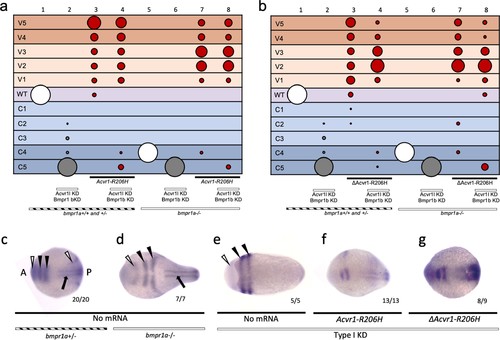
(a–b) Injected bmpr1a+/- or -/- 12 to 30 hpf embryo phenotypes with bmpr1b KD, acvr1 KD with or without Acvr1-R206H or ΔAcvr1-R206H mRNA. Two pooled experiments. (a) Acvr1-R206H injected embryos. Columns: 1, N = 150; 2, N = 80; 3, N = 98; 4, N = 89; 5, N = 76; 6, N = 36; 7, N = 31; 8, N = 30. (b) ΔAcvr1-R206H injected embryos. Columns: 1, N = 150; 2, N = 80; 3, N = 92; 4, N = 127; 5, N = 76; 6, N = 36; 7, N = 26; 8, N = 37. (c–i) Representative dorsal view of pax2.1 (white arrowheads: anteriorly in the midbrain-hindbrain boundary and posteriorly in the pronephric mesoderm), krox20 (black arrowheads; rhombomeres 3 and 5), and myod (black arrow; paraxial mesoderm) expression in 5–9 somite stage bmpr1a+/-or -/- embryos with bmpr1b KD, acvr1 KD with or without Acvr1-R206H or ΔAcvr1-R206H. Two independent experiments. Embryos are oriented with the anterior (A) side left and the posterior (P) side right. Number of embryos that showed expression patterns similar to the representative embryos out of the total number of embryos analyzed is shown. (c) bmpr1a+/- embryo (d) bmpr1a-/- embryo (e) bmpr1a-/-embryo with acvr1l and bmpr1b KD (Type I KD embryo) (f) Type I KD embryo injected with Acvr1-R206H mRNA. (g) Type I KD embryo injected with ΔAcvr1-R206H mRNA. EXPRESSION / LABELING:
PHENOTYPE:
|
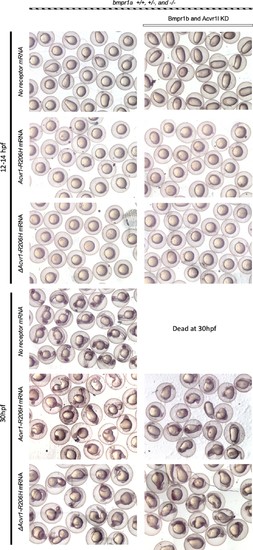
Representative 12 and 30 hpf phenotypes of injected embryos. Dead C5 embryos were removed from 30hpf live embryos prior to photographing. |

(a) 12–30 hpf phenotypes of bmpr1a+/-or -/- embryos with bmpr1b KD and acvr1l KD with or without ACVR1-R206H, with or without chordin (chd) mRNA or bmp7 mRNA. Four pooled experiments plus two experiments with controls only. Columns: 1, N = 172; 2, N = 160; 3, N = 106; 4, N = 135; 5, N = 104; 6, N = 121; 7, N = 169; 8, N = 117; 9, N = 32; 10, N = 91; 11, N = 17; 12, N = 57; 13, N = 29; 14, N = 28; 15, N = 49; 16, N = 49. (b–g) Representative dorsal view of pax2.1, krox20, and myod expression in 5–9 somite stage bmpr1a+/-or -/- embryos with bmpr1b KD, acvr1 KD, with or without ACVR1-R206H, and with or without chordin or bmp7 mRNA. Three experiments. Embryos are oriented with the anterior (A) side left and the posterior (P) side right. Number of embryos that showed expression patterns similar to the representative embryos out of the total number of embryos analyzed is shown. (b) bmpr1a +/- embryo (c) bmpr1a-/-embryo (d) bmpr1a-/-embryo with acvr1l and bmpr1b KD (Type I KD embryo) (e) Type I KD embryo injected with ACVR1-R206H and chd mRNA (f) Type I KD embryo injected with ACVR1-R206H mRNA (g) Type I KD embryo injected with ACVR1-R206H and bmp7 mRNA. |
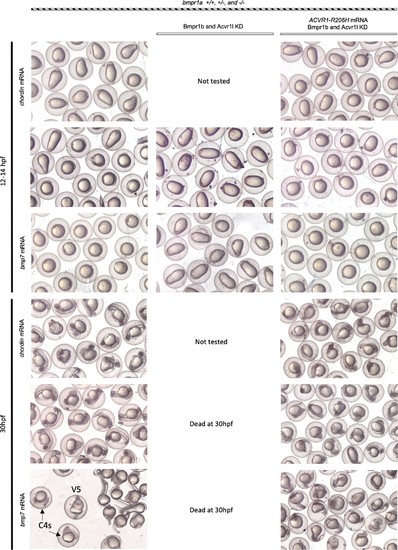
Dead C5 embryos were removed from 30hpf live embryos prior to photographing. C4 (bmpr1aa-/-;ab-/-) and V5 (bmpr1a+/+;ab-/-) embryos indicated in bmpr1aa+/-;bmpr1ab-/-cross progeny injected with bmp7; showing that bmp7 overexpression does not rescue the bmpr1aa-/-;ab-/-C4 phenotypes. |