FIGURE SUMMARY
Title

Keratins and Plakin family cytolinker proteins control the length of epithelial microridge protrusions

Authors
Inaba, Y., Chauhan, V., van Loon, A.P., Choudhury, L.S., Sagasti, A.
Source
Full text @ Elife

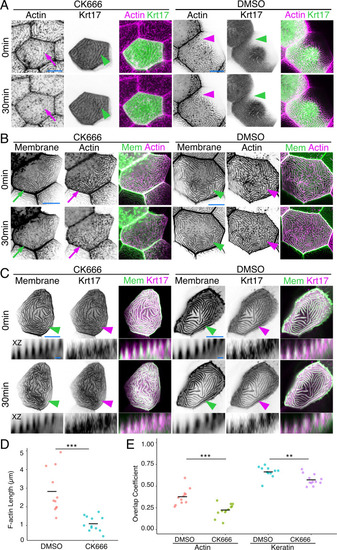
(A) SIM optical sections of a Krt17-GFP[BAC]-expressing zebrafish periderm cell at 48hpf. Cartoon shows the relative location of apical (A) and medial (M) optical sections. (B) Oblique optical section through a cell with endogenously-tagged Krt17. This section shows both the microridge-like pattern at the apical cell surface (arrow) and a filamentous pattern deeper in the cell (arrowhead). (C) Projections and orthogonal views of SIM images of Krt17-GFP[BAC]- and Lifeact-mRuby-expressing cells at the indicated developmental stages. White boxes, regions of magnification in zoom panels. Orthogonal views (XZ) at 19hpf show that Krt17 is not in pegs but at 48hpf localizes alongside F-actin in microridges. Dashed lines outline cell membranes. (D) Section (XY) and orthogonal (XZ) views of SIM images of Krt17-GFP[BAC]- and Lifeact-mRuby-expressing cells at 48hpf. ‘-’: No keratin in protrusion. ‘+’: Keratin partially occupies microridge. ‘++': Keratin fully occupies microridge. Blue lines show the location of XZ optical sections. Dashed lines outline cell membranes. (E) Plot showing keratin localization in actin protrusions of different sizes (area) at 48hpf. The presence of keratin was scored as in D. n = 3 cells from two fish. (F) Dot and box-and-whisker plots of average microridge length per cell in WT cells expressing Lifeact-mRuby, and cells expressing Krt17-GFP[BAC] and Lifeact-mRuby at 48hpf. *p<0.05, the Wilcoxon rank-sum test. n = 24 cells from four fish in Krt17-GFP[BAC]-expressing fish and 69 cells from nine fish in WT. WT data is the same as in Figure 4B. Box-and-whisker plots (F): Middle line shows the median; the upper and lower ends of the box are the 75th and 25th percentiles. Black-and-white images were inverted so that high-intensity fluorescence appears black and low fluorescence is white. Scale bars: 10 µm (A-C, blue line) and 1 µm (C-D white line).

Keratins localize in two patterns in periderm cells.

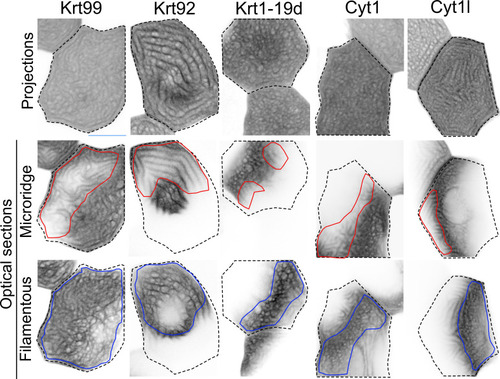
GFP-tagged keratin BAC reporters expressed in periderm cells at 48hpf. The first row shows maximum intensity projections, the second and third rows show optical sections highlighting the microridge-like pattern at the apical surface of cells (red outlines) or the filamentous pattern within the same cells (blue outlines). Dashed lines indicate the outlines of individual periderm cells. Images were inverted so that high-intensity fluorescence appears black and low-intensity fluorescence is white. Video 1 shows all optical sections for these images. Scale bar: 10 µm.

Keratins retain microridge structure.

(A) Krt17-GFP[BAC]- and Lifeact-mRuby-expressing cells in 48hpf fish, at time 0 and 30 min after treatment with DMSO or the Arp2/3 inhibitor CK666. Arrows show that the F-actin microridge pattern was disrupted after 30 min of CK666 treatment. Arrowheads show that the keratin microridge pattern was retained after 30 min of CK666 or DMSO treatment. (B) GFP-PH-PLC (membrane) and Lifeact-mRuby in 48hpf periderm cells at time 0 and 30 min after treatment with DMSO or CK666. GFP-PH-PLC was expressed by injecting Krt5:Gal4 into UAS:GFP-PH-PLC fish; Krt5:Lifeact-mRuby was expressed by transient transgenesis. Arrows show that the membrane and actin microridge patterns were disrupted after 30 min of CK666 treatment. Arrowheads show that the membrane and actin microridge patterns were retained in DMSO controls. (C) Projection and orthogonal views of GFP-PH-PLC and Krt17-mRuby[BAC] in 48hpf periderm cells at time 0 and 30 min after treatment with DMSO or CK666. GFP-PH-PLC was expressed by injecting Krt5:Gal4 into UAS:GFP-PH-PLC fish; Krt17-mRuby[BAC] was expressed by transient transgenesis. Arrowheads show that membrane protrusion and Krt17 microridge patterns were retained after 30 min of DMSO or CK666 treatment. Orthogonal views (XZ) show that Krt17 preserved the protrusive membrane structure after 30 min of CK666 treatment. (D) Dot plot of average microridge length per cell at 48hpf after 30 min treatment with DMSO or CK666. Line indicates average. ***p<0.005, the Wilcoxon rank-sum test. n = 11–12 cells from three fish. (E) Dot plot of microridge and keratin overlap coefficients, comparing the colocalization of each protein at 0 min with its localization after 30 min DMSO or CK666 treatment. Line indicates average. **p<0.01, ***p<0.005, the Wilcoxon rank-sum test. n = 11–12 cells from three fish. Black-and-white images were inverted so that high-intensity fluorescence appears black and low-intensity fluorescence is white. Scale bars: 10 µm (A–C) and 1 µm (orthogonal images in C).

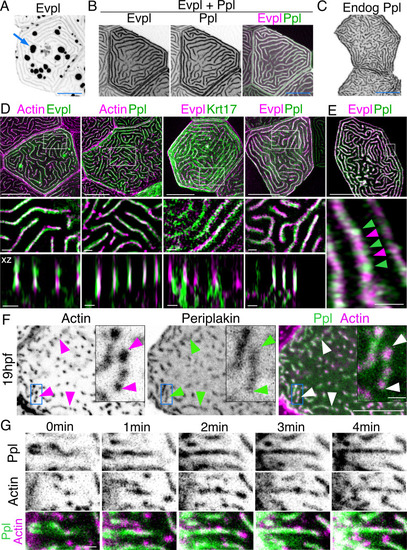
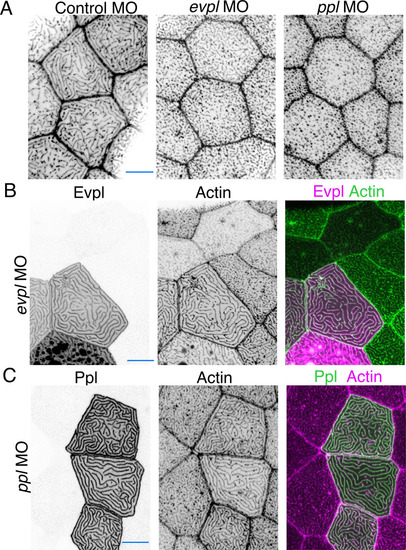
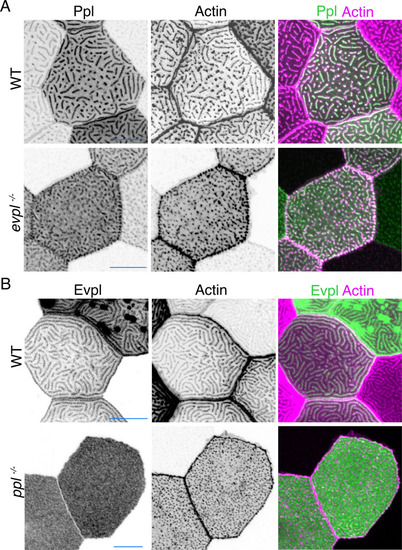
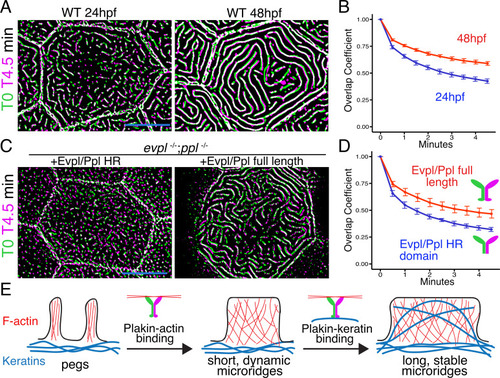
(A) Evpl-mRuby[BAC]-expressing periderm cells in 48hpf zebrafish show Evpl localization in aggregates (e.g. arrow) and microridges. (B) Evpl-mRuby[BAC] and Ppl-GFP[BAC] co-expression in a periderm cell at 48hpf. (C) Endogenously GFP-tagged Ppl in periderm cells at 48hpf. (D) Projection and orthogonal views of SIM images of the indicated co-expressed reporters. White boxes, regions of magnification in middle panels. Bottom panel, orthogonal view (apical up, basal down). (E) Confocal Airyscan image of cells expressing Ppl-GFP[BAC] and Evpl-mRuby[BAC]. White box, region of magnification in lower panel. Arrowheads show alternating arrangement of Ppl and Evpl in microridges. (F) Ppl-GFP[BAC] and Lifeact-mRuby expression in a 19hpf periderm cell. Arrowheads point to representative areas in which Ppl localizes to longer structures than actin pegs. Boxes, area of magnification for insets. (G) Sequential projections from a time-lapse movie of Ppl-GFP[BAC]- and Lifeact-mRuby-expressing periderm cells at the end of cytokinesis (24hpf). Note that Ppl structures appear to precede F-actin in developing protrusions. Black-and-white images were inverted so that high-intensity fluorescence appears black and low-intensity fluorescence is white. Scale bars: 10 µm (A–F) and 1 µm (zoomed and orthogonal views in D, F, and G).

Evpl associates with Ppl in microridges.

(A) Evpl-mRuby[BAC] expression in periderm cells of 48hpf zebrafish showing localization to aggregates (arrow) and microridges. Image is a zoomed out version of the image used in Figure 3A. (B) Ppl-GFP[BAC] expression in periderm cells of 48hpf zebrafish showing localization to microridges. (C) Projections of periderm cells in two different fish (each row) co-expressing Evpl-mRuby[BAC] and Ppl-GFP[BAC] at 48hpf. (D) Proportion of cells with aggregates in Evpl- or Evpl/Ppl-expressing cells. Black-and-white images were inverted so that high-intensity fluorescence appears black and low-intensity fluorescence is white. Scale bars: 10 µm.

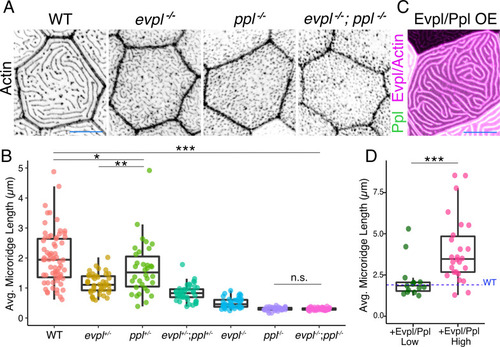
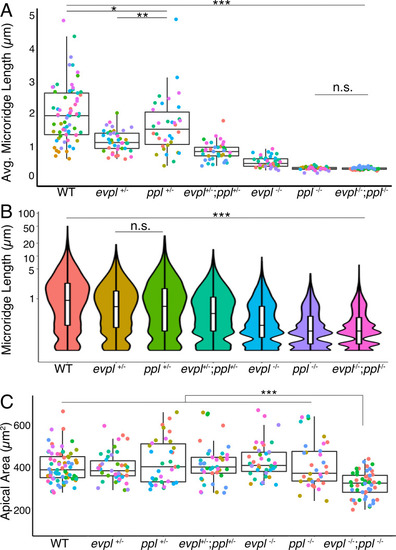
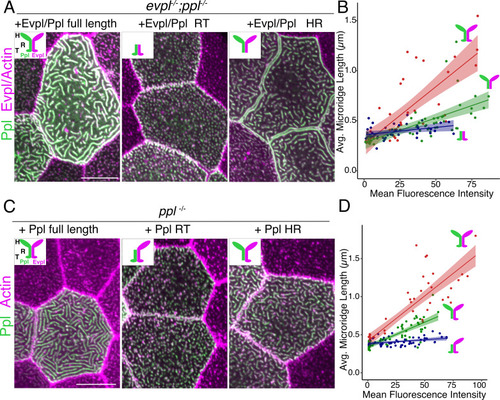
(A) Periderm cells expressing Lifeact-mRuby in WT, evpl−/−, ppl−/−, and evpl−/−;ppl−/− mutants at 48hpf. Images were inverted so that high-intensity fluorescence appears black and low-intensity fluorescence is white. (B) Dot and box-and-whisker plot of average microridge length per cell at 48hpf from animals of the indicated genotypes. All comparisons between each genotype were significantly different from one another, except where indicated as n.s. *p<0.05, **p<0.01; for all other comparisons ***p<0.0001, the Wilcoxon rank-sum test. The exact P values for all comparisons are shown in Supplementary file 1. n = 27–69 cells from 3 to 9 fish per genotype. Another version of this graph color-coding cells from each animal is provided in Figure 4—figure supplement 2A, as well as a violin plot showing the length distributions of all microridges pooled (Figure 4—figure supplement 2B, Supplementary file 1). To control for animal-to-animal variation, we have also analyzed these data by averaging the microridge length averages for each cell in each animal (i.e. each animal is represented by one number averaging all cells). This approach yielded similar results and are reported in Supplementary file 1. (C) Cells overexpressing Evpl-mRuby[BAC], Ppl-GFP[BAC], and Lifeact-mRuby at 48hpf. (D) Dot and box-and-whisker plot of average microridge length per cell in cells over-expressing Evpl-mRuby[BAC] and Ppl-GFP[BAC] at 48hpf. See Figure 4—figure supplement 7 for categorization into ‘low’ and ‘high’ overexpression groups. ***p<0.0001, the Wilcoxon rank-sum test. n = 41 cells from five fish. Dotted blue line shows the median average microridge length per cell in WT animals (from B). Box-and-whisker plots (B and D): Middle line shows the median; the upper and lower ends of the box are the 75th and 25th percentiles. Scale bars: 10 µm.

<italic>evpl</italic> and <italic>ppl</italic> mutants.

(A) The evpl gene targeting strategy. Sequence shows the deletion site. Bottom-left panel shows PCR analysis of genomic DNA isolated from adult fish fins with the indicated genotypes. Primers Fw1 and Rev1 were used to detect WT alleles (743 bp) and primers Fw1 and Rev2 were used to detect mutant alleles (576 bp). Bottom-right shows RT-PCR of RNA isolated from adult fish scales with the indicated genotypes. Primers Fw3 and Rev3 were used to detect WT (638 bp) and mutant (167 bp) alleles. (B) The ppl gene targeting strategy. Sequence shows the deletion site. Bottom-left panel shows PCR analysis of genomic DNA isolated from adult fish fins with the indicated genotypes. Primers Fw1 and Rev1 were used to detect the WT (404 bp) allele and primers Fw1 and Rev2 were used to detect the mutant allele (468 bp). Bottom-right shows RT-PCR of RNA isolated from adult fish scales with the indicated genotypes. Primers Fw3 and Rev3 were used to detect WT (571 bp) and mutant (107 bp) alleles.

Additional quantification of microridge length and cell area in <italic>evpl</italic> and <italic>ppl</italic> mutants.

(A) Dot and box-and-whisker plot of average microridge length per cell of the indicated genotypes, at 48hpf. Same data as in Figure 4B but with colors representing cells from different animals. *p<0.05, **p<0.01, and ***p<0.0001, the Wilcoxon rank-sum test. (B) Box-and-whisker and violin plot of microridge length, pooled from all measured cells, of the indicated genotypes. ***p<0.0001, the Wilcoxon rank-sum test. (C) Dot and box-and-whisker plot of apical cell areas at 48hpf from animals of indicated genotypes. Colors represent cells from different animals. n = 27–69 cells from 3 to 9 fish per genotype. ***p<0.0001, the Wilcoxon rank-sum test. Box-and-whisker plots: Middle line shows the median; the upper and lower ends of the box are the 75th and 25th percentiles. Exact P values for all comparisons are shown in Supplementary file 1.

Plakin BAC reporters rescue microridge development in plakin mutants.

(A) Lifeact-GFP-expressing cells mosaically expressing Evpl-mRuby[BAC] in periderm cells. Microridges were rescued by BAC expression (compare to neighboring control cells lacking mRuby). These and subsequent black-and-white images were inverted so that high-intensity fluorescence appears black and low-intensity fluorescence is white. (B) Lifeact-mRuby-expressing cells mosaically expressing Ppl-GFP[BAC] in periderm cells. Microridges were rescued by BAC expression (compare to neighboring control cells lacking GFP). Scale bar: 10 µm.

<italic>evpl-</italic> and <italic>ppl</italic>-targeting morpholinos disrupt microridge development.

(A) Actin (Lifeact-mRuby) in control morpholino (MO)-, evpl MO-, and ppl MO-injected embryos at 48hpf. These and subsequent black-and-white images were inverted so that high-intensity fluorescence appears black and low-intensity fluorescence is white. (B) Lifeact-GFP-expressing periderm cells in evpl MO-injected embryos, also mosaically expressing Krt5:Evpl-tdTomato. Microridges were rescued by cDNA expression (compare to neighboring control cells lacking tdTomato). (C) Lifeact-mRuby-expressing periderm cells in ppl MO-injected embryos, also mosaically expressing Krt5:Ppl-GFP. Microridges were rescued by cDNA expression (compare to neighboring control cells lacking GFP). Scale bars: 10 µm.

Microridges in adult fish were disrupted in <italic>evpl</italic> and <italic>ppl</italic> mutants.

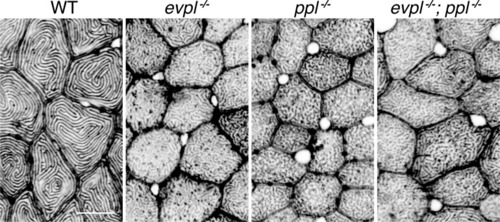
Actin (phalloidin staining) of skin covering adult scales in WT, evpl−/−, ppl−/−, and evpl−/−;ppl−/− mutants. Images were inverted so that high-intensity fluorescence appears black and low-intensity fluorescence is white. Scale bar: 10 µm.

e<italic>vpl</italic> and <italic>ppl</italic> mutant morphologies.

Zebrafish of the indicated genotypes at larval (48hpf) and adult (>3 months) stages. Scale bar: 1 mm for larvae and 5 mm for adults.

Evpl and Ppl dictate microridge length.

(A) Images of periderm cells expressing Evpl-mRuby[BAC], Ppl-GFP[BAC], and Lifeact-mRuby at 48hpf. Image is a zoomed out and rotated version of the image used in Figure 4C. Black-and-white images were inverted so that high-intensity fluorescence appears black and low-intensity fluorescence is white. (B) Scatter plot of average microridge length versus mean GFP fluorescence intensity in periderm cells overexpressing Evpl-mRuby[BAC] and Ppl-GFP[BAC]. Cells were divided into high and low fluorescence intensity groups, as indicated, and used in analysis shown in Figure 4D. n = 41 cells from five fish. Scale bar: 10 µm.

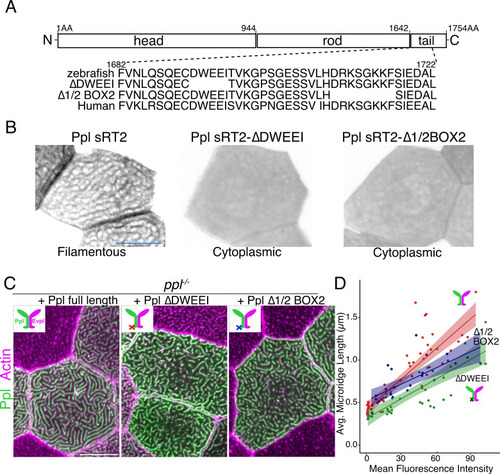
(A) Periderm cells expressing Evpl-tdTomato and Ppl-GFP variants at 48hpf. Schematics indicate the domains in each variant. (B–C) Optical sections of GFP-tagged Ppl truncated rod-tail fusions expressed in periderm cells at 48hpf. Sections highlight the microridge-like pattern at the apical surface of cells (left, red outlines) or the filamentous pattern deeper in cells (right, blue outlines). Top: Diagram of Ppl protein domains. Amino acid numbers are indicated. See Figure 5—video 1 for video showing apical-to-basal sections of these images. Images were inverted so that high-intensity fluorescence appears black and low-intensity fluorescence is white. Scale bars: 10 µm.

Evpl depends on Ppl for apical localization, but not vice versa.

(A) Ppl-GFP[BAC]- and Lifeact-mRuby-expressing WT and evpl−/− periderm cells. Ppl localized to microridges in WT and pegs/short microridges in evpl−/− periderm cells at 48hpf. (B) Evpl-GFP[BAC]- and Lifeact-mRuby-expressing WT and ppl−/− periderm cells at 48hpf. Evpl localized to microridges in WT and to the cytoplasm in ppl−/− cells. Black-and-white images were inverted so that high-intensity fluorescence appears black and low-intensity fluorescence is white. Scale bars: 10 µm.

The periplakin head domain is required for initiation of microridge morphogenesis and the tail domain is required for microridge elongation.

(A, C) Lifeact-mRuby-expressing cells mosaically expressing Ppl-GFP and Evpl-tdTomato variants in periderm cells, as indicated. Neighboring cells lacking GFP serve as controls. (A) Periderm cells of evpl−/−;ppl−/− mutant animals co-expressing full-length tagged Evpl and Ppl (left), tagged Evpl and Ppl rod-tail fusions (middle), or tagged Evpl and Ppl head-rod fusions (right). Inset schematics show the domains expressed. H: Head; R: Rod; T: Tail. (B) Scatter plot of average microridge length versus mean fluorescence intensity in evpl−/−;ppl−/− mutant periderm cells expressing full-length Evpl and Ppl (red line), Evpl and Ppl head-rod fusions (green line), or Evpl and Ppl rod-tail fusions (blue line). Shading indicates 95% confidence interval. Slopes = 0.0115, 0.0049, and 0.0015; R2 = 0.56, 0.44, and 0.13 for red, green, and blue lines, respectively. n = 39–55 cells from 3 to 4 fish per category. (C) Periderm cells of ppl−/− mutant animals co-expressing tagged Ppl full length (left), Ppl rod-tail (middle), or Ppl head-rod fusions (right). Insets illustrate the Ppl domains expressed. Green is Ppl and magenta is endogenous Evpl in diagrams. H: Head; R: Rod; T: Tail. (D) Scatter plot of average microridge length versus mean fluorescence intensity in ppl−/− periderm cells expressing full-length Ppl (red line), the Ppl head-rod (green line), or the Ppl rod-tail (blue line). These full-length data are also used in Figure 7C–D. Shading indicates 95% confidence interval. Slopes = 0.0118, 0.0064, and 0.001; R2 = 0.74, 0.67, and 0.15 of red, green, and blue lines, respectively. n = 37–57 cells from 3 to 5 fish per category. Scale bar: 10 µm.

Keratin-binding domains of periplakin are required for microridge elongation.

(A) Top: Diagram of Ppl protein domains. Amino acid numbers are indicated above. Bottom: Amino acid sequence of IF-binding domains of zebrafish and human Ppl, showing locations of the ∆DWEEI and ∆1/2BOX2 mutations. (B) Images of tagged Ppl(sRT2)-, Ppl(sRT2-∆DWEEI)-, and Ppl(sRT2-∆1/2BOX2)-expressing periderm cells in WT animals. (C) Lifeact-mRuby-expressing periderm cells mosaically expressing GFP-tagged Ppl (left), the Ppl(∆DWEEI) mutant (middle), or the Ppl(∆1/2BOX2) mutant (right) in ppl−/− mutant animals. Neighboring cells lacking GFP serve as controls. (D) Scatter plot of average microridge length versus mean fluorescence intensity in ppl−/− periderm cells expressing full-length Ppl (red line), Ppl(∆DWEEI) (green line), or Ppl(∆1/2BOX2) (blue line). Shading indicates 95% confidence interval. Slopes = 0.0118, 0.0077, and 0.0064; R = 0.74, 0.6, and 0.54, for red, green, and blue lines, respectively. n = 24–51 cells from 3 to 4 fish per category. Scale bars: 10 µm.

The periplakin tail domain is required to stabilize microridges.

(A) Superimposition of first and last frames from a time-lapse movie of WT cells expressing Lifeact-GFP at the indicated developmental stages. Green: Starting time point, Magenta: 4.5 min time point. Overlap is white. (B) Line plots of overlap coefficients at the indicated stages, comparing each time point to the first. n = 21–33 cells from 4 to 5 fish per category. Bars = 95% confidence interval. (C) Superimposition of first and last frames from a time-lapse movie of evpl−/−;ppl−/− double mutant animals expressing Lifeact-GFP, rescued with the indicated Evpl and Ppl fusions. (D) Line plots of overlap coefficients in cells expressing the indicated Evpl and Ppl fusions, comparing each time point to the first. n = 11 cells from 3 to 4 fish per category. Bars = 95% confidence interval. (E) Two-step model of microridge morphogenesis. First, plakins interact with F-actin via their head domains to fuse pegs into short microridges. Second, plakin-keratin interactions through plakin tail domains stabilize microridges, allowing them to further elongate. Scale bars: 10 µm.

Acknowledgments
This image is the copyrighted work of the attributed author or publisher, and ZFIN has permission only to display this image to its users. Additional permissions should be obtained from the applicable author or publisher of the image. Full text @ Elife