FIGURE SUMMARY
Title

Systems Analysis of Biliary Atresia Through Integration of High-Throughput Biological Data

Authors
Min, J., Ningappa, M., So, J., Shin, D., Sindhi, R., Subramaniam, S.
Source
Full text @ Front. Physiol.

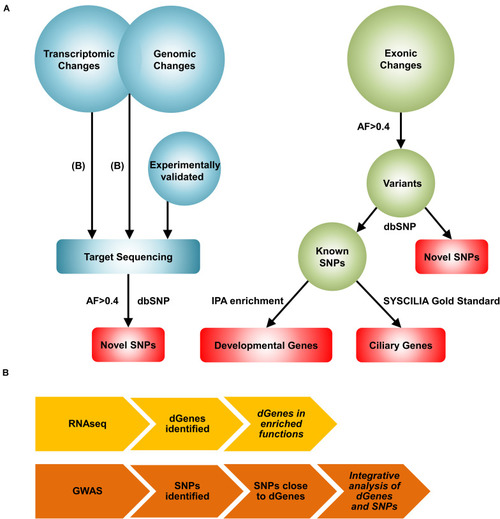
A novel systems biology approach for the reconstruction of the BA network. (A) Workflow of the Systems Biology approach. First, transcriptomic changes were analyzed from the RNAseq data to identify differentially regulated genes in the BA group. The list of differentially regulated genes were then used together with the list of significant genomic changes from the GWAS analysis to identify pairs of significant genes and SNPs. These results, along with experimentally validated genes, were further explored with target sequencing to identify highly common (AF>0.4 and AN>10) novel SNPs. Exomic changes were also examined with whole exome sequencing. From the whole exome data, the dbSNP 138 database was used to identify novel and known SNPs. Developmental genes mapped from the highly common known SNPs were identified using Ingenuity Pathway Analysis (IPA) enrichment. BA-related ciliary genes were identified with the SYSCILIA gold standard list. Red represents the genes and variants considered for the reconstruction of the BA network. AF: allele frequency, AN: total number of alleles. (B) The workflows for the transcriptomic and the integrative analyses are shown. For transcriptomic profiling, RNAseq analysis was performed to identify differentially regulated genes (dGenes). Then, enrichment analysis was performed to identify over-represented biological functions and pathways among dGenes. The integrative analysis involved selection of SNPs near dGenes from the GWAS data and application of set-based test in PLINK to identify pairs of significant genes and SNPs. Italicized results were target sequenced.

Differentially regulated genes in enriched biological categories. (A) Differentially regulated genes in the chemokine signaling pathway (p = 2.0E-3). (B) Differentially regulated genes in inflammatory response from Gene Ontology: Biological Process terms (p = 2.9E-5). Red indicates upregulation while green indicates downregulation. All genes passed the adjusted p-value cutoff of 0.1 using Benjamini-Hochberg method.

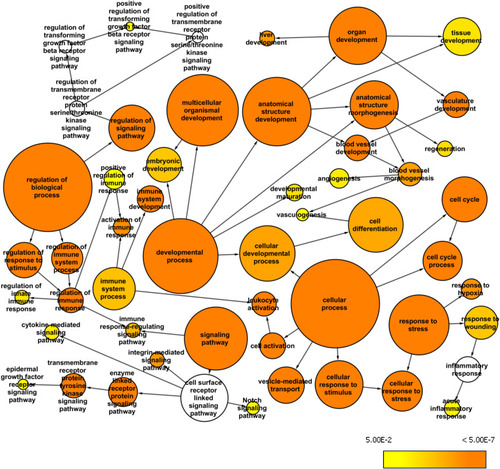
Whole exome network. This network was created in Cytoscape with the BINGO plugin to visualize over-represented Gene Ontology: Biological Processes among the genes mapped from the common variants from the whole exome data (AF>0.2 and AN>10) and their first neighbor genes within the custom human interaction network. The size of a node represents the number of genes annotated with that biological process while the color indicates different p-values for the significance of enrichment.

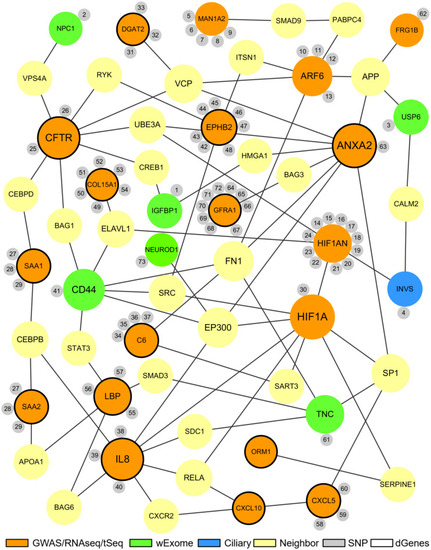
The proposed biliary atresia network. This network was created in Cytoscape by using the second neighbor interactions of the significant genes within the custom human interaction network. Interaction with other significant genes was the key criteria for selection into the final BA network. The size of a node depends on the connectivity within the network; the larger the node, the more connected it is to other genes. The orange nodes represent the significant genes derived from the GWAS, RNAseq, or target sequencing data while the light green nodes represent the significant genes from the whole exome data. One blue ciliary gene is also from the whole exome data. The yellow nodes represent the neighbor genes that link different significant genes through protein-protein interaction. The small gray nodes represent the SNPs that are associated with their attached genes. The entire list of SNPs, both novel and known, can be found in the Supplementary Tables. The black circular edges around the nodes represent differentially regulated genes (p < 0.05).

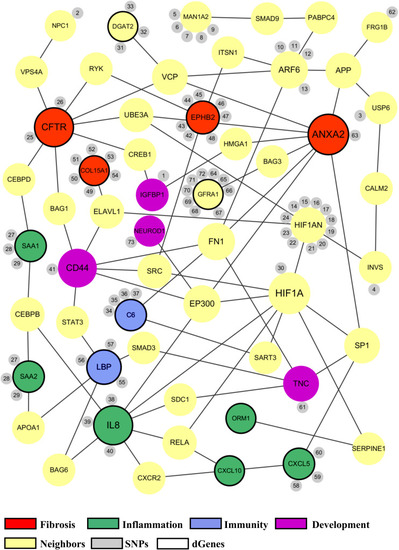
Common biological functions in the proposed biliary atresia network. All of the significant genes in the proposed BA network were annotated to identify common biological functions within the network. The red nodes represent the genes related to fibrosis, green related to inflammation, blue related to immune response, and purple related to development. The size of a node depends on the connectivity within the network; the larger the node, the more connected it is to other genes. The yellow nodes represent the neighbor genes that link different significant genes through protein-protein interaction. The small gray nodes represent the SNPs that are associated with their attached genes. The entire list of SNPs, both novel and known, can be found in the Supplementary Tables. The black circular edges around the nodes represent differentially regulated genes (p < 0.05).

Activation of Hif1a signaling impairs biliary morphogenesis. (A) Epifluorescence images showing PED6 accumulation in the gallbladder (arrows). (B) Confocal projection images showing BODIPY C5 staining (green) and Tp1:mCherry-CAAX expression (red; BEC membrane) in the liver (dotted lines). Scale bars: 200 (A), 50 μm (B).

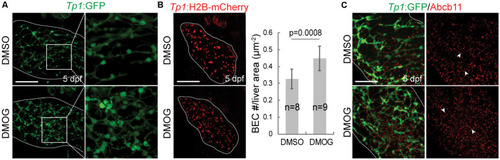
Activation of Hif1a signaling increases BEC number and impairs the proper formation of bile canaliculi. (A) Confocal projection images showing intrahepatic biliary network by Tp1:GFP expression in the liver (dotted lines) at 5 dpf. Boxed regions are enlarged. (B) Confocal projection images showing Tp1:H2B-mCherry expression (red; BEC nuclei) in the liver (dotted lines) at 5 dpf. Quantification of BEC number is shown. (C) Confocal projection images showing Abcb11 and Tp1:GFP expression in the liver (dotted lines) at 5 dpf. Arrowheads point to bile canaliculi. n indicates the number of larvae used for quantification. Scale bars: 50 μm; error bars: ± SD.

Acknowledgments
This image is the copyrighted work of the attributed author or publisher, and ZFIN has permission only to display this image to its users. Additional permissions should be obtained from the applicable author or publisher of the image. Full text @ Front. Physiol.