
- Title
-
The Orphan G-Protein Coupled Receptor 182 Is a Negative Regulator of Definitive Hematopoiesis through Leukotriene B4 Signaling
- Authors
- Kwon, H.B., Mackie, D.I., Bonnavion, R., Mercier, A.L., Helker, C.S.M., Son, T., Guenter, S., Serafin, D.S., Kim, K.W., Offermanns, S., Caron, K.M., Stainier, D.Y.R.
- Source
- Full text @ ACS Pharmacol Transl Sci
gpr182 is highly expressed in endothelial cells in zebrafish. (A–I) Brightfield images of whole-mount in situ hybridization (WISH) for gpr182 expression at 30 (A–C), 48 (D–F), and 60 (G–I) hpf. The red and green boxes in the left panels (A, D, G) are enlarged in the middle (B, E, H) and right (C, F, L) panels, respectively. Red and yellow arrows point to cells exhibiting strong expression of gpr182 in the ventral part of the DA (red) and in the PCV (yellow), respectively. Anterior to the left, dorsal to the top. (J–Q) Images of sectioned embryos after WISH for gpr182 expression in 36 hpf Tg(fli1a:EGFP) animals in the trunk (J–M) and tail (N–Q) region. The red boxes in panels J, K, N, and O are enlarged in their respective bottom panels (L, M, P, Q). Red and yellow arrows point to cells exhibiting strong expression of gpr182 in the ventral part of the DA (red) and in the PCV (yellow), respectively. (R) Schematic representation of EC sorting from 30 hpf TgBAC(etsrp:EGFP) embryos. (S) qPCR analysis of kdrl, fli1rs, and gpr182 mRNA expression levels in isolated ECs and non ECs from 30 hpf TgBAC(etsrp:EGFP)embryos. N = 6 biologically independent samples. A delta delta Ct (ΔΔCt) analysis was performed and EC expression levels were set at 1. Data are mean ± s.d., and a two-tailed Student’s t test was used to calculate Pvalues. The threshold cycle (Ct) values are in Table S2. (T) Heatmap analysis of gpr182 expression in nonhemogenic ECs (kdrl+/runx1–), specified HECs (HE, kdrl+/runx1+), and potential HSCs (kdrl–/runx1+) sorted from 28 hpf Tg(kdrl:mCherry/runx1:EGFP) embryos.(18)Heatmap was generated according to z-score of reads per kilobase per million reads (RPKMs) of each gene in multiple samples. RPKM and z-scores are summarized in Figure S1(A). (U) Schematic illustration showing gpr182 expression in ECs in the trunk (30 hpf) and tail (60 hpf) region. Scale bars, 200 μm (A, D, G), 50 μm (B, C, E, F, H, I, J–Q). CVP, caudal vein plexus; DA, dorsal aorta; ISV, intersegmental vessel; NC, notochord; NT, neural tube; PCV, posterior cardinal vein. |

Zebrafish gpr182 mutant embryos exhibit wild-type-like vascular development. (A) Partial DNA sequence of the gpr182–/– allele (bns289) generated for this study. Red arrow points to the mutated region. (B) Schematic representation of wild-type and mutant Gpr182. Green boxes indicate the transmembrane domains (TM). Red hexagon indicates C-terminus. (C) High-resolution melt analysis (HRMA) of gpr182+/+, gpr182+/−, and gpr182–/– DNA. (D) Representative brightfield images of 72 hpf wild-type and gpr182–/–larvae. (E) Confocal images of 72 hpf Tg(kdrl:Hsa.HRASmCherry) wild-type and gpr182–/–larvae. (F) Microangiography of 72 hpf Tg(kdrl:Hsa.HRASmCherry) wild-type and gpr182–/–larvae injected intravascularly with 2000 kDa FITC-dextran; lateral views. Scale bars, 200 μm (D, F), 50 μm (F). Anterior to the left, dorsal to the top. PHENOTYPE:
|

ZFIN is incorporating published figure images and captions as part of an ongoing project. Figures from some publications have not yet been curated, or are not available for display because of copyright restrictions. |

Zebrafish gpr182 mutant embryos exhibit increased HE and HSC formation. (A) Brightfield images of WISH for cmyb expression in wild-type and gpr182–/– embryos at 36 hpf. White arrows point to cmyb positive cells in the trunk. N/N, number of embryos showing representative phenotype/total number of embryos examined. Two independent experiments were performed with similar results. (B) qPCR analysis of cmyb mRNA levels from wild-type and gpr182–/– embryos at 36 hpf. N = 5 biological replicates. A delta delta Ct (ΔΔCt) analysis was performed and wild-type expression levels were set at 1. Data are mean ± s.d., and a two-tailed Student’s t test was used to calculate P values. (C) Confocal images of Tg(cd41:EGFP); Tg(kdrl:Hsa.HRASmCherry) wild-type and gpr182–/– embryos in the trunk at 48–52 hpf. White arrows point to cd41/kdrl double-positive cells in the trunk. (D) Number of cd4l/kdrl double-positive cells in the trunk (six somites). Wild-type N = 10, gpr182–/–N = 13. N obtained from three independent clutches. (E) Brightfield images of WISH for cmyb expression in wild-type and gpr182–/– larvae at 96 hpf. N/N, number of embryos showing representative phenotype/total number of embryos examined. Two independent experiments were performed with similar results. (F) Confocal images of Tg(cd41: EGFP); Tg(kdrl: Hsa.HRASmCherry) wild-type and gpr182–/– larvae in the tail at 72 hpf. White arrows point to weak EGFP positive HSCs in the tail. (G) Number of weak cd41:EGFP positive HSCs in the tail (4 somites) of wild-type and gpr182–/– embryos. Wild-type (N = 12) and gpr182–/– (N = 17), from three independent clutches. (H) Time-lapse confocal images of Tg(cmyb:GFP); Tg(kdrl:Hsa.HRASmCherry) wild-type and gpr182–/–embryos at 36 hpf in the trunk. White arrows point to cmyb/kdrl double-positive HE/HSCs. The red, orange, green, blue and purple boxes in the above panels are enlarged in the bottom panels, respectively. Yellow (1′–2′′) and white (3′–5′′) arrowheads in the bottom panels point to HE/HSCs of the wild-type and gpr182–/–embryo, respectively. (I) Confocal images of Tg(cmyb:GFP); Tg(kdrl:Hsa.HRASmCherry) uninjected and gpr182 mRNA injected embryos at 36 hpf. White arrows point to cmyb/kdrl double positive cells in the trunk. (J) Quantification of cmyb/kdrl double-positive cells in the trunk (six somites). Uninjected embryos (N = 7) and gpr182 wild-type mRNA injected embryos (N = 8), from three independent clutches. Data are mean ± s.d.. A two-tailed Student’s t test was used to calculate p-values. Scale bars, 50 μm. Anterior to the left, dorsal to the top. DA, dorsal aorta; CV, caudal vein; PCV, posterior cardinal vein; VDA, ventral wall of DA. PHENOTYPE:
|

Zebrafish and mouse gpr182 mutants exhibit an increased number of myeloid cells. (A) Confocal images of 60 hpf Tg(mpeg1:mCherry) wild-type and gpr182–/– embryos in the tail. White arrows point to mpeg1:mCherry positive cells. (B) Number of mpeg1:mCherry positive cells in tail (six somites). Wild-type (N = 7), gpr182–/–(N = 9), from three independent clutches. (C) Confocal images of 72 hpf Tg(lyz:EGFP); Tg(kdrl:Hsa.HRASmCherry) wild-type and gpr182–/–larvae in the tail. White arrows point to lyz:EGFP positive cells. (D) Number of lyz:EGFP positive cells in the tail (six somites). Wild-type embryos (N = 13), gpr182–/–embryos (N = 13), from three independent clutches. (E–G) Whole blood analysis of 6-week old C57/B6 wild-type (N = 8) and GPR182 KO (N = 7) mice. (H) Bright-field images of 6-weeks old wild-type and GPR182 KD mouse spleens. (I) Number of wild-type (N = 3) and GPR182 KD (N = 5) mouse spleen sizes. (J) Bright-field images of P0 wild-type and GPR182 KD mouse spleens. (K) Quantification of P0 wild-type (N = 7) and GPR182 KD (N = 11) mouse spleens. Spleen size was normalized by body weight and P0 wild-type spleen size was set at 1. Data are mean ± s.d. and a two-tailed Student’s t test was used to calculate p-values. (L) Bright-field images of 6-months old adult wild-type and gpr182–/– zebrafish spleen (see Figure S1D). Scale bars, 50 μm (A, C), 1 mm (D). BASO, basophils; CHT, caudal hematopoietic tissue; CV, caudal vein; DA, dorsal aorta; EO, Eosinophils; KD, knockdown; KO, knockout; MONO, monocytes; PCV, posterior cardinal vein; RBCs, red blood cells. |
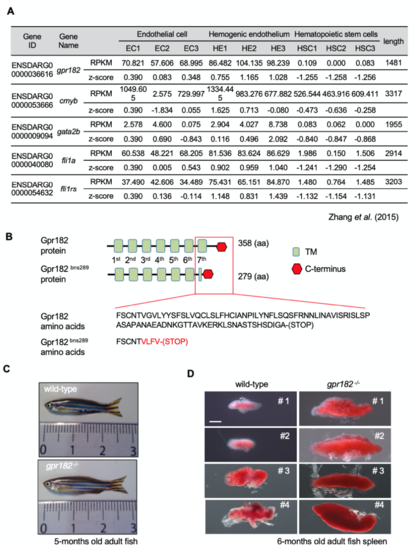
Adult gpr182 mutant zebrafish present with bigger spleens than wild-type. (A) Table showing mRNA levels of gpr182 as well as EC, HE and HSC marker genes from the RNA seq dataset. RNA seq dataset consists of mRNA isolated from non-hemogenic ECs (ECs, kdrl+/runx1−), specified HE (HE, kdrl+/runx1+), and HSCs (HSC, kdrl−/runx1+) from 28 hpf Tg(kdrl:mCherry); Tg(runx1:EGFP) embryos2. (B) Gpr182 and Gpr182bns289 proteins. The bns289 mutation causes a premature stop codon at amino acid 279, resulting in the loss of the 7th putative trans membrane domain (TM) and the intracellular domain. (C) Brightfield images of 5-months old wild-type and gpr182 -/- zebrafish. (D) Brightfield images of 6-months old wild- type and gpr182 -/- zebrafish spleen. Scale bar: 1 mm (D). RPKMs, reads per kilobase per million reads; HE, hemogenic endothelium; HSC, hematopoietic stem cell. |