FIGURE SUMMARY
Title

More Bone with Less Minerals? The Effects of Dietary Phosphorus on the Post-Cranial Skeleton in Zebrafish

Authors
Cotti, S., Huysseune, A., Koppe, W., Rücklin, M., Marone, F., Wölfel, E.M., Fiedler, I.A.K., Busse, B., Forlino, A., Witten, P.E.
Source
Full text @ Int. J. Mol. Sci.

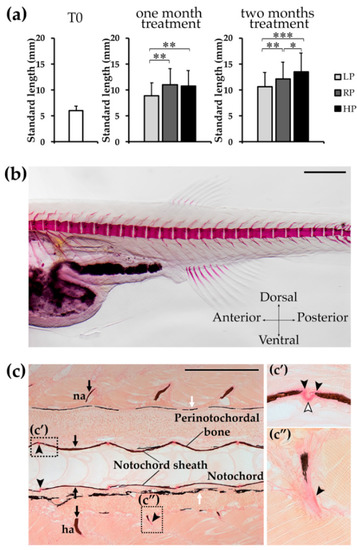
Zebrafish growth and T0 animals. (a) Morphometric analysis of WT zebrafish at the beginning of the experiment (T0, 28dpf) and after one and two months of treatment with the experimental diets. Animals treated with the low P diet (LP) are smaller than controls (RP) and high P diet (HP) treated animals, whereas HP zebrafish present a significantly increased standard length. Mann-Whitney test, *: p < 0.05; **: p < 0.01; ***: p < 0.001. (b) T0 zebrafish, prior the beginning of the experiment, stained with Alizarin red S shows normally developed vertebral column and forming vertebral bodies. No vertebral column malformations, nor vertebral body fusion or compression are present. Scale bar: 500 μm. (c) Notochord sheath, perinotochordal membranous bone and neural (na) and haemal (ha) arches are mineralised in T0 animals, as shown by Von Kossa/Van Gieson staining on sagittal sections. Vertebral bodies are normally shaped and spaced. High magnification panels show (c’) vertebral endplates with osteoid (black arrowheads) and intervertebral ligament (white arrowhead, see Figure 6a for details), (c”) haemal arch with non-mineralised collagen matrix (black arrowhead). Mineralised bone: brown (black arrows); pigment: black (white arrows), non-mineralised collagen matrix/osteoid: red (black arrowhead). Scale bar: 200 µm.

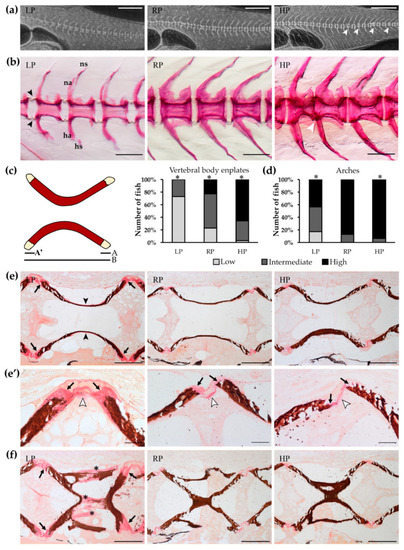
Mineralisation levels of vertebral column after two months of dietary treatment. (a) Vertebral column of low P diet (LP) treated animals is characterised by reduced radiodensity compared to controls (RP) and high P diet (HP) treated animals. HP zebrafish present multiple vertebral body fusions (white arrowheads). Scale bar: 1 mm. (b) Alizarin red S staining of vertebral columns shows vertebral body endplates (black arrowheads) characterised by low mineralisation levels in LP animals, intermediate mineralisation in controls and high mineralisation levels in HP animals. HP zebrafish present vertebral body fusion (white arrowhead). Neural (na) and haemal arches (ha) are low-mineralised and their spines (ns, hs, respectively) are deformed in LP individuals compared to RP and HP zebrafish. Scale bar: 200 µm. (c) Quantitative analysis of vertebral body endplate mineralisation: the non-mineralised endplate is expressed as percentage of the total non-mineralised endplate length (A + A’) over the total vertebral length (B), (A + A’)/B. Chi squared or Fisher’s exact test, pairwise comparison, *: p < 0.05. (d) Qualitative analysis of arch mineralisation levels. Please see Materials and Methods for further details. Chi squared or Fisher’s exact test, pairwise comparison, *: p < 0.05. (e) Sagittal sections of vertebral bodies show large areas of non-mineralised matrix at the level of the vertebral endplates (black arrows) in LP animals compared to RP and HP animals. LP individuals present also a thin osteoid layer in the outer part of the vertebral body (black arrowheads), completely absent in RP and HP animals. Scale bar: 100 µm. (e’) High magnification of endplates in panel e. Extended non-mineralised bone matrix (black arrows) is visible in the vertebral endplates of LP animals. RP and HP zebrafish present thin endplates with reduced osteoid (black arrows). White arrowheads indicate intervertebral ligaments (see Figure 6a for details). Scale bar: 20 µm. (f) Mineralisation of bone trabeculae (asterisks) is also affected by low P levels in the diet. Black arrows: endplates. Von Kossa/Van Gieson staining: mineralised bone: brown; non-mineralised collagen matrix/osteoid: red. Scale bar: 100 µm.

Mineralisation levels of median fin structures after two months of dietary treatment. Pterygiophores or radials, endoskeletal structures supporting the dorsal (a) and anal (b) fins (black arrows), present reduced mineralisation levels in low P diet (LP) treated zebrafish, in comparison with controls (RP) and high P diet (HP) fed animals. Likewise, Alizarin red S staining shows impaired mineralisation of dorsal and anal fin rays in LP animals. Scale bar: 500 µm. (c) Analysis of pterygiophores and quantitative analysis of fin rays mineralisation levels. Pterygiophores mineralisation levels were qualitatively evaluated as low, intermediate or high depending on Alizarin red S distribution in the bone. Fin rays mineralisation levels were quantitatively analysed: low, more than two non-mineralised segments; intermediate, one or two non-mineralised segments; high: all segments mineralised. Chi squared or Fisher’s exact test, pairwise comparison, *: p < 0.05. (d) Caudal fin rays stained with Alizarin red S display reduced mineralisation in LP animals compared to RP and HP zebrafish. Scale bar: 500 µm.

High dietary P is associated with higher stiffness in the bone formed after two months of treatment. (a) Schematic representation of nanoindentation measurements in the sagittal plane of a vertebral body. (b) In the endplates, the elastic modulus as indicator for stiffness shows significantly higher values in HP compared to LP (*: p = 0.004), and a trend towards higher values in HP compared to RP (p = 0.073). In the central region, all dietary groups showed similar values. (c) The hardness of the vertebrae was similar in all dietary groups in both the endplates and central regions.

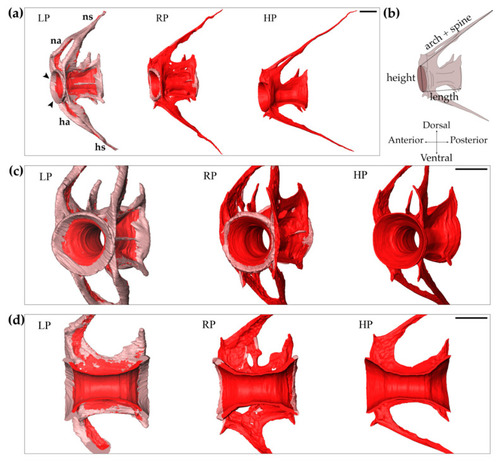
Increased bone formation in LP zebrafish after two months of dietary treatment. Synchrotron X-ray tomographic microscopy scans reveal an increased amount of non-mineralised matrix in the vertebral body and arches of low P diet (LP) treated animals compared to controls (RP) and high P diet (HP) treated individuals. (a) Lateral view of the 10th caudal vertebral body, neural (na) and haemal (ha) arches and their spines (ns, hs, respectively). Vertebral endplates are indicated by black arrowheads. Scale bar: 100 µm. (b) Schematic representation of the measured parameters: vertebral body length, vertebral body height, length of arch plus spine. (c) Frontal view of vertebrae. Scale bar: 100 µm. (d) Virtual sagittal sections of the vertebral bodies. Scale bar: 100 µm. Non-mineralised bone: pink; mineralised bone: red.

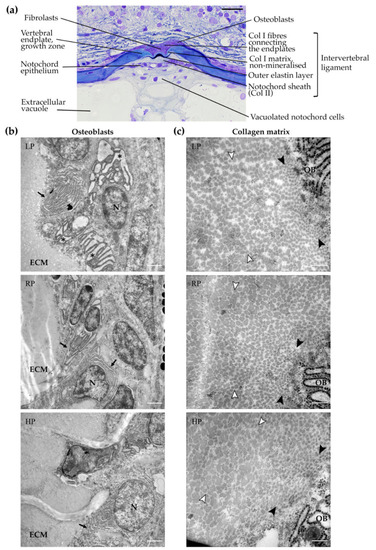
Osteoblasts and collagen type I in the vertebral body endplate growth zone. (a) Representative toluidine blue stained semi-thin sagittal section showing internal structures of zebrafish vertebral centra and intervertebral ligament. Vertebral endplates are normally spaced and fully extended in all dietary groups. The notochord sheath is composed of collagen type II (Col II) secreted by the cells of the notochord epithelium, also named chordoblasts. Vertebral bodies are interconnected by the notochord sheath and by collagen type I (Col I) fibres outside the notochord. All structures of the intervertebral ligament are unaltered. Osteoblasts in the vertebral endplate growth zone are located outside the notochord sheath between collagen type I fibres. Inside, the notochord is composed by vacuolated notochord cells and extracellular vacuoles. Scale bar: 20 µm. (b) Transmission electron microscopy images of osteoblasts in the vertebral endplate growth zone after two months of dietary treatment. Osteoblasts are active and present a high number of endoplasmic reticulum (ER) cisternae (black arrows), which are enlarged in low P diet (LP) treated animals (asterisks) compared to controls (RP) and high P diet (HP) treated animals, indicative of increased bone matrix production. ECM: extracellular matrix, N: nucleus. Scale bar: 1 µm. (c) Higher magnification of collagenous bone matrix located at the vertebral endplates. Collagen type I fibres in the immediate vicinity of osteoblasts (OB) have similar diameters among the three dietary groups, as well as collagen fibres located at a distance from the osteoblasts, within the extracellular matrix, indicative of unaltered fibre maturation. Black arrowheads: fibres in the vicinity of the osteoblasts with small diameters; white arrowheads: fibres at a distance from osteoblasts with large diameters. Scale bars: 200 nm.

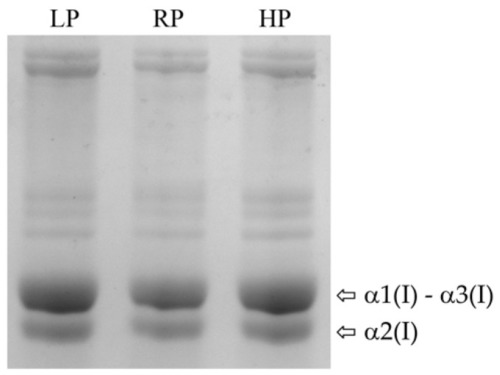
Electrophoretic analysis of collagen type I. Coomassie stained SDS-Urea-PAGE of collagen type I extracted from bone of low P diet (LP) treated zebrafish, controls (RP) and high P diet (HP) treated animals (pool of 2 samples per dietary group). Zebrafish present three collagen type I α chains (α(I)), named α1(I), α3(I) and α2(I). Collagen α(I) chains show bands with similar electrophoretic migration in all dietary groups.

Acknowledgments
This image is the copyrighted work of the attributed author or publisher, and ZFIN has permission only to display this image to its users. Additional permissions should be obtained from the applicable author or publisher of the image. Full text @ Int. J. Mol. Sci.