
- Title
-
Her9/Hes4 is required for retinal photoreceptor development, maintenance, and survival
- Authors
- Coomer, C.E., Wilson, S.G., Titialii-Torres, K.F., Bills, J.D., Krueger, L.A., Petersen, R.A., Turnbaugh, E.M., Janesch, E.L., Morris, A.C.
- Source
- Full text @ Sci. Rep.

EXPRESSION / LABELING:
|
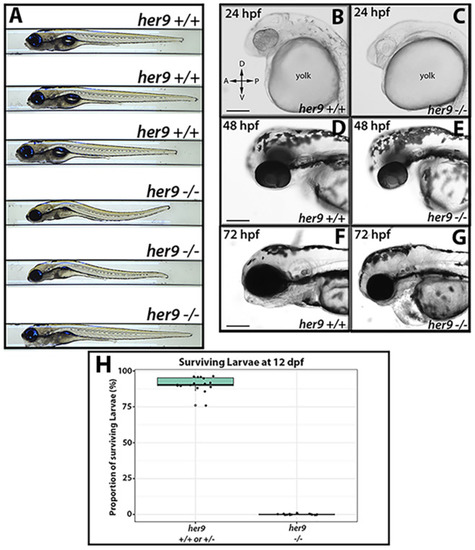
PHENOTYPE:
|
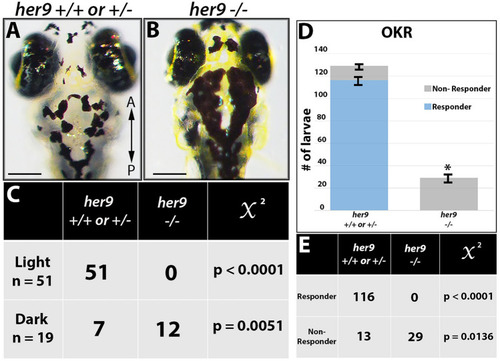
Her9 mutants lack a VBA response and display abnormal visual behavior (OKR). ( PHENOTYPE:
|

|

Cone outer segments are abnormal in |

|

Loss of PHENOTYPE:
|
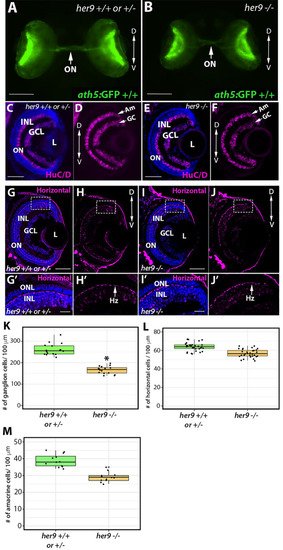
Loss of PHENOTYPE:
|

CMZ defects in PHENOTYPE:
|

EXPRESSION / LABELING:
PHENOTYPE:
|

Her9 mutant retinas display increased apoptosis beginning at 72 hpf. ( |

RA regulates |

ZFIN is incorporating published figure images and captions as part of an ongoing project. Figures from some publications have not yet been curated, or are not available for display because of copyright restrictions. PHENOTYPE:
|
|
ZFIN is incorporating published figure images and captions as part of an ongoing project. Figures from some publications have not yet been curated, or are not available for display because of copyright restrictions. PHENOTYPE:
|