
- Title
-
Capn3 depletion causes Chk1 and Wee1 accumulation and disrupts synchronization of cell cycle reentry during liver regeneration after partial hepatectomy
- Authors
- Chen, F., Huang, D., Shi, H., Gao, C., Wang, Y., Peng, J.
- Source
- Full text @ Cell Regen (Lond)

Generation of |
Defective development of EXPRESSION / LABELING:
|

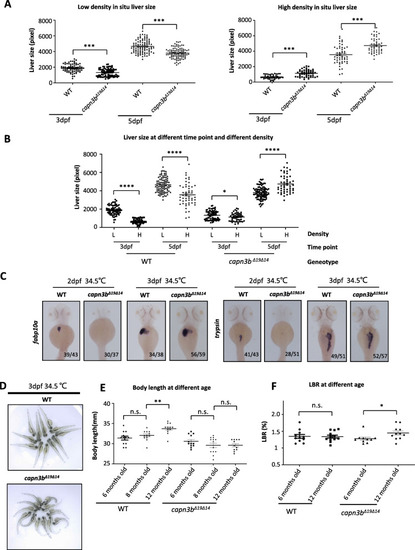
Delayed hepatocyte proliferation in PHENOTYPE:
|
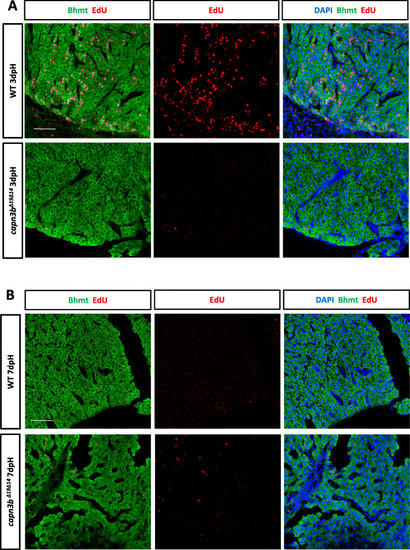
Delayed hepatocyte proliferation in PHENOTYPE:
|

Clustering analysis of the mass spectrometry data of nuclear proteins from WT and |
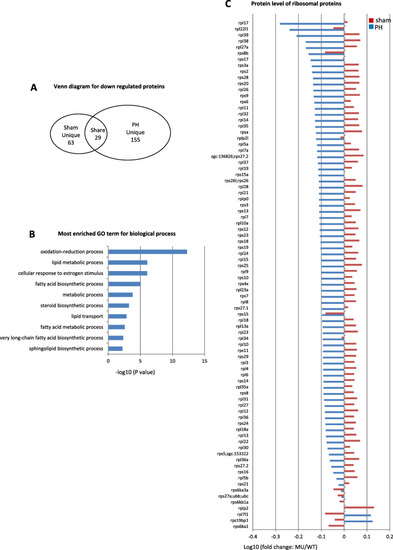
Down-regulation of proteins related to lipid metabolism and ribosomal function in |
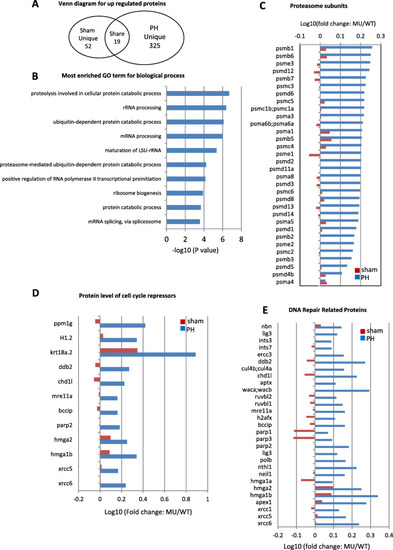
Up-regulation of proteins related to 26S proteasome and cell cycle arrest in |
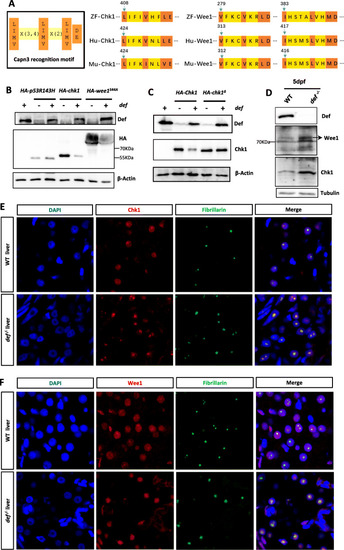
Chk1 and Wee1 are substrates of the Def-Capn3b complex. |
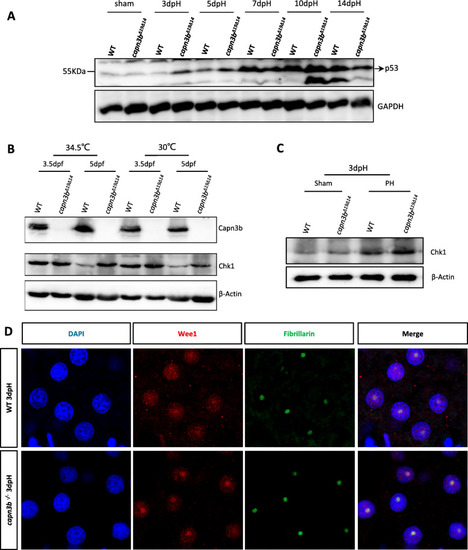
Hepatic accumulation of Chk1 and Wee1 in EXPRESSION / LABELING:
PHENOTYPE:
|