
- Title
-
Human ARF Specifically Inhibits Epimorphic Regeneration in the Zebrafish Heart
- Authors
- Lee, S., Hesse, R., Tamaki, S., Garland, C., Pomerantz, J.H.
- Source
- Full text @ Genes (Basel)
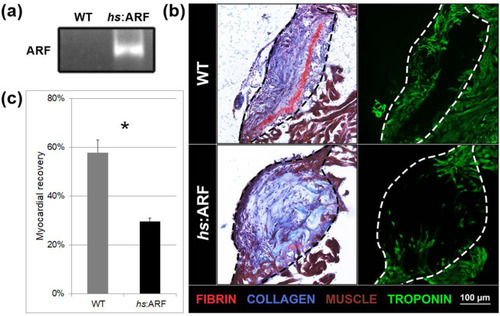
Induced Alternative Reading Frame (ARF) expression in |
ARF expressed under control of the endogenous human |

ARF expressed under control of the endogenous human |

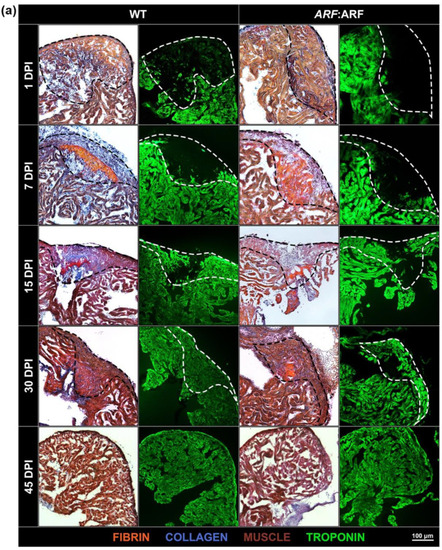
ARF expressed in PHENOTYPE:
|
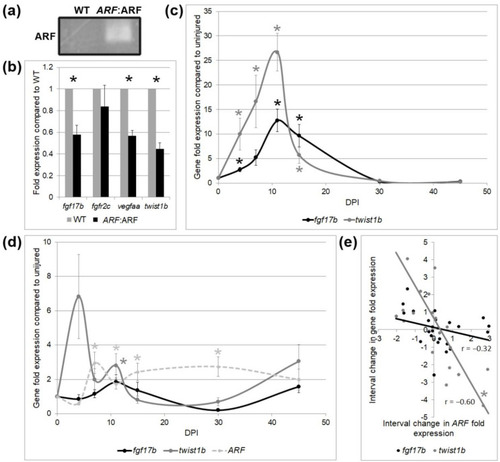
Tissue-specific gene expression by qPCR in WT and |