FIGURE SUMMARY
Title

Tissue-Specific Requirement for the GINS Complex During Zebrafish Development

Authors
Varga, M., Csályi, K., Bertyák, I., Menyhárd, D.K., Poole, R.J., Cerveny, K.L., Kövesdi, D., Barátki, B., Rouse, H., Vad, Z., Hawkins, T.A., Stickney, H.L., Cavodeassi, F., Schwarz, Q., Young, R.M., Wilson, S.W.
Source
Full text @ Front Cell Dev Biol

ZFIN is incorporating published figure images and captions as part of an ongoing project. Figures from some publications have not yet been curated, or are not available for display because of copyright restrictions.

PHENOTYPE:
Fish:
Observed In:
Stage: Day 5

u773 mutants show tectal apoptosis. (A,B) Lateral views of 2 dpf live wildtype (A) and u773 mutant (B) embryos. The arrowhead in (B) indicates dying tectal cells. (C,D) Transverse sections of the tecta of u773 mutants and siblings showing TUNEL labeled apoptotic cells (blue, arrowheads). (E,F) Lateral views of 5 dpf live wildtype (E) and u773 mutant (F) larvae. (G–H’) Dorsal views of brains of u773 mutants and siblings labeled with anti-acetylated tubulin (red) and SV2 antibodies showing organization of cells, processes and neuropil. (G’,H’) show magnified views of the boxes in (G) and (H). Note that in the u773 mutant, tubulin staining is aberrant. Scale bars: 200 μm.

u773 is a loss-of-function allele of gins2. (A) Initial region of Chromosome 18 that segregated with the u773 mutant phenotype. (B) WGS mapping plot of SNP homozygosity on Chromosome 18. (C) Sanger sequencing results aligned to the reference sequence of gins2 for u773 mutants and ekwill controls. (Note that gins2 is on the reverse strand and the sequence is shown in the reverse direction). (D) Multiple sequence alignment of Gins2/Psf2 protein sequences in different species. The red box and asterisk denotes the lysine residue affected in u773 mutants. (E) Protein lysates from uninjected (cntrl) and gins2MO-injected 2 dpf embryos were separated with SDS-PAGE and then subjected to western blotting with Gins2 and γ-tubulin antibodies. (F,G) Phenotype of 2 dpf gins2MO injected embryos and uninjected controls (black arrowhead indicates dead cells). Scale bars: 250 μm. (H) Graph showing the fraction of morphants showing the gins2u773 phenotype at the indicated gins2MO concentrations.

PHENOTYPE:
Fish:
Knockdown Reagent:
Observed In:
Stage: Long-pec

gins2 functions cell-autonomously and is expressed in proliferating tissues. (A,B) TUNEL staining (red) of wildtype host embryos receiving heterologous cell transplants labeled with membrane-tethered GFP (green) from wildtype and gins2MO-injected embryos. (A’,B’) show magnified views of the boxes in (A,B). (C–I’) Lateral views (C–I) and transverse section (I’) of the wildtype embryos assessed for zygotic gins2 expression with whole mount in situ hybridization at the indicated stages. (J) Western blot analysis of protein lysates from wildtype embryos probed with Gins2 and γ-tubulin antibodies. Scale bars: (A,B) 50 μm; (C–I) 150 μm.

EXPRESSION / LABELING:
Gene:
Fish:
Anatomical Terms:
Stage Range: 8-cell to Long-pec

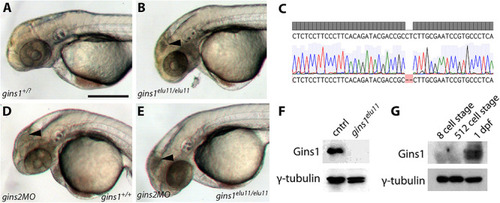
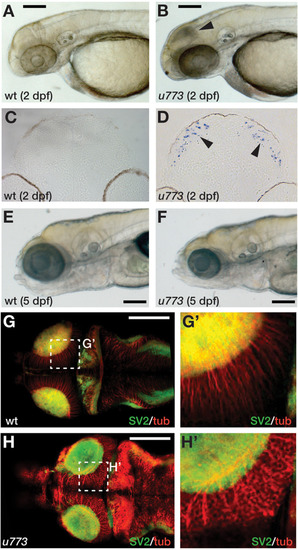
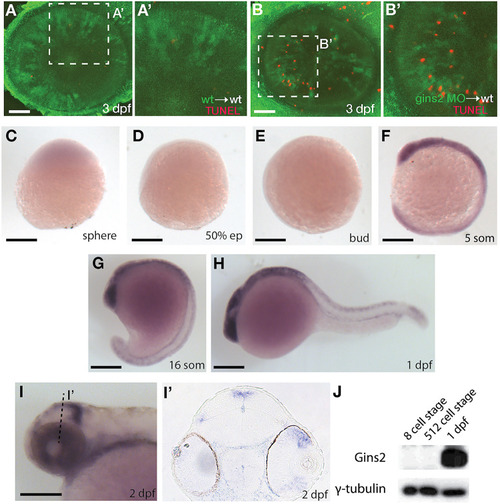
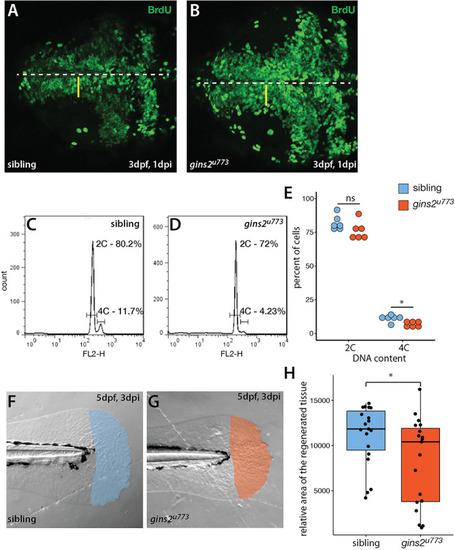
Gins1 deficient and Gins1, Gins2 double-deficient embryos show comparable cell death phenotypes in eyes and tecta. (A,B) The gins1elu11 frameshift allele created through genome editing shows retinal and tectal apoptosis at 2 dpf, similar to other CMG mutants. (C) Sanger sequencing of gins1elu11/elu11 embryos shows the presence of the homozygous c.250_251delCT mutation. (D,E) Phenotype of gins1 mutant embryos and their siblings injected with 100 μM gins2MO. (F) Western blot analysis of protein lysates from 2 dpf control and gins1elu11/elu11 embryos probed with Gins1 and γ-tubulin antibodies. (G) Western blot analysis of protein lysates from wildtype embryos at the indicated stages probed with Gins1 and γ-tubulin antibodies. Scale bar: 250 μm.

gins2u773 mutants show cell proliferation defects. (A,B) The intensity of fluorescence of BrdU labeling in the OT of a 3 dpf wildtype embryo shows a medio-lateral gradient. In contrast, mutant embryos showed a uniform distribution of the BrdU label. Dorsal views of the OT are shown, with anterior to the left. Midline is marked by the dashed line, yellow bars denote the proliferative area with a medial to lateral gradient of fluorescence in wildtype. (C,D) Representative histograms of flow cytometry analysis of wildtype and mutant samples. (E) DNA content analysis of propidium-iodide-labeled cells isolated from the head region showed no obvious change in the number of cells with 2C (p = 0.15, n = 6), and a slight, but significant decrease in the number of cells with 4C (p = 0.01, n = 6 independent samples). (F,G) Regenerated area of the caudal fin in wildtype siblings and mutant embryos following amputation at 2 dpf. (H) At 3 days post injury (dpi) the size of the regenerated fin fold was slightly but significantly smaller in mutant larvae than in controls (p = 0.038, n = 19).

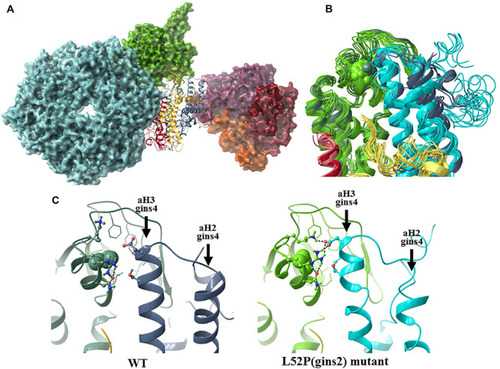
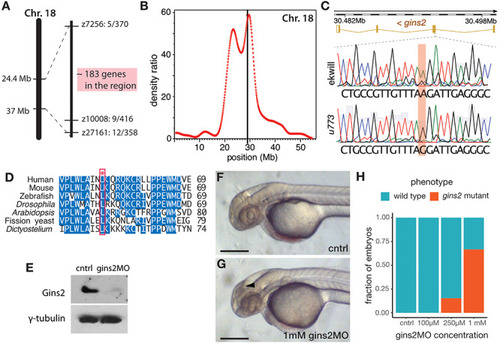
The structural consequences of the Gins2L52P mutation in the zebrafish GINS complex. (A)In silico generated model of the MCM-Cdc45-GINS-Ctf4 complex built using structures 3jc5 (Yuan et al., 2016), 4c8h (Simon et al., 2014), and the homology model of the zebrafish GINS complex created in this study. The MCM hexamer (cyan), Cdc45 (green), and the Ctf14 homotrimer (purple, red, and orange) are shown as surfaces, while GINS as a ribbon diagram (Gins1: yellow, Gins2: green, Gins3: red, Gins4: blue). (B) Superposition of the most populated cluster mid-structures (accounting for >90% of all structures of the equilibrium trajectory). Coloring of the Gins monomers is the same as before, darker shades are used for the wildtype, the lighter for the mutant structures (residue 52 of Gins2 shown in space-filling representation). (C) Detailed view of the site of the mutation, with a typical H-bonding motif also illustrated.

Acknowledgments
This image is the copyrighted work of the attributed author or publisher, and ZFIN has permission only to display this image to its users. Additional permissions should be obtained from the applicable author or publisher of the image. Full text @ Front Cell Dev Biol