|
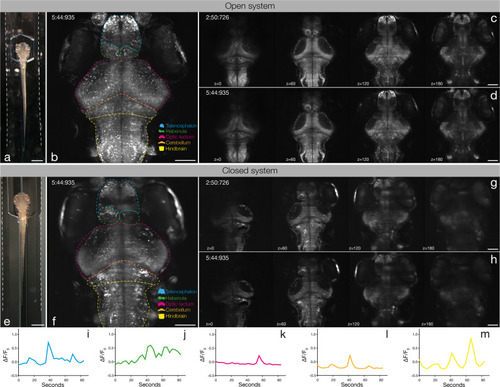
Whole-brain in vivo imaging in the NeuroExaminer.a, e A live 6 dpf Tg(elavl3:H2B-GCaMP6s); crystal larva in an open a or closed e version of the NeuroExaminer. The outer borders of the open a or closed e microfluidic device are outlined with dotted white lines; the recess area above the larva’s head in a is marked by a dotted blue line (see also Supplementary Movie 8). b, f A maximum intensity projection consisting of 21 optical sections at 5 min and 45 s (time is indicated in min:s:ms) depicting nuclear-localized GCaMP6s throughout the larva’s brain in the open b and closed f system (see also Supplementary Movies 3, 4). Dotted color-coded lines outline five major brain regions depicted on the lower right. c, d and g, h Neural activity patterns at four single optical sections spaced 60 µm apart at two indicated time points (shown in min:s:ms) in the open c, d and closed g, h NeuroExaminer (see also Supplementary Movies 5, 6). Note that optical sections in the open system are spatially well-resolved throughout the entire brain c, d, whereas in the closed system dorsal sections display a spatially better resolution than ventral sections localized deeper in the brain g, h. i–m Single-cell color-coded calcium signals (25 frames; ~84 s) for the fish in the closed system in the telencephalon (i, blue), habenula (j, green), optic tectum (k, magenta), cerebellum (l, orange), and hind brain (m, yellow; see also Supplementary Movie 7). Scale bar is 500 µm in a and e and 100 µm in b–d and f–h.
|