FIGURE SUMMARY
Title

Pcdh18a regulates endocytosis of E-cadherin during axial mesoderm development in zebrafish

Authors
Bosze, B., Ono, Y., Mattes, B., Sinner, C., Gourain, V., Thumberger, T., Tlili, S., Wittbrodt, J., Saunders, T.E., Strähle, U., Schug, A., Scholpp, S.
Source
Full text @ Histochem. Cell Biol.

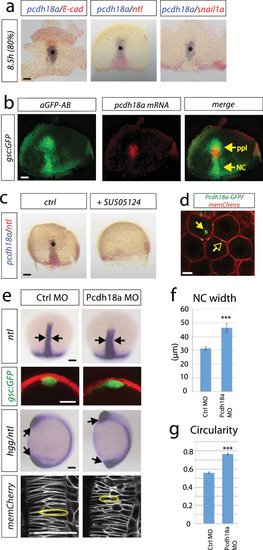
A cell group in the axial mesoderm regulates notochord morphogenesis in zebrafish. a Characterization of the prechordal plate (ppl) by whole-mount double in situ hybridization (ISH) of wild-type (WT) zebrafish embryos with the indicated markers. Scale bar: 100 µm. b Mapping of pcdh18a mRNA expression (red) relative to Tg(gsc:GFP) expression labelled by anti-GFP antibody (green). Notably, gsc:GFP labels the prechordal plate (ppl) and the trailing notochord (NC). Scale bar: 100 µm. c Inhibition of nodal signalling by SB505124 treatment (30 µM) from 4 to 8.5 h post-fertilization (hpf). Scale bar: 100 µm. d Confocal image of live zebrafish embryo at 5 hpf showing subcellular localization of Pcdh18a-GFP. Glycosylphosphatidylinositol-anchored mCherry (memCherry) marks cell membranes. Arrows indicate punctae of Pcdh18a localization at the membrane (open arrows) and intracellularly (closed arrows). Scale bar: 10 µm. e WT embryos or Tg(gsc:GFP) embryos were injected with Pcdh18a MO (0.5 mM). Morpholino-based knockdown of Pcdh18a leads to a wider and shorter notochord marked by ntl expression at 9 hpf (arrows). See Supplementary Fig. S1h for control experiments. Analysis of the shape of the notochord in a cross section of gsc:GFP transgenic embryos that were injected with the indicated constructs at 10 hpf. At 11 hpf, the body length was significantly shorter in the Pcdh18a-deficient embryos, as shown in an ISH-based analysis of notochord hgg/ntl (n = 20/32, arrows). Confocal microscopy-based analysis of cell shapes in the notochord of embryos that were microinjected with the indicated constructs at 12 hpf (cells with exemplary morphology were surrounded with a yellow circle). Scale bar: 100 µm. fpcdh18a MO-injected embryos show a wider axial mesoderm compared to Ctrl MO injected embryos (four embryos each). g Circularity of NC cells was measured in total of 1000 cells in five different embryos each. A circle has a circularity of 1.0, while noncircular shapes have a lower value of circularity. The error bars represent the SEM and significance as indicated (***p value < 0.001; unpaired Student’s t test)

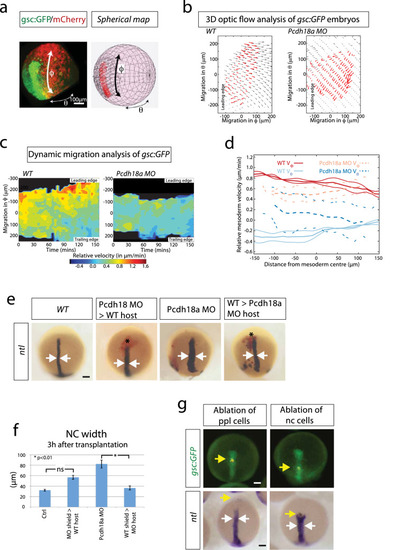
Analysis of the influence of the ppl on notochord morphogenesis. ad 3D-optic flow analysis. a Spherical mapping of the optic flow of the fluorescent signal of a gsc:GFP/memCherry embryo onto a spherical coordinate system with θ as azimuth angle and ϕ as polar angle. b 2D Mercator projection of flow field of mesoderm (red arrows) compared with ectoderm above (black arrows). Both embryos analysed at 5 hpf. c The corresponding heat map kymograph shows the relative velocity of the mesoderm roughly every 5 min. d Thick solid (dashed) lines are smoothed average profiles of wild-type (WT; Pcdh18a deficient) embryos, with individual embryo profiles shown in lighter lines in ϕ (red/orange) and θ (light/dark blue) directions. epcdh18a MO donor shield was transplanted into WT hosts and vice versa. After 3 h, the embryos were fixed and subjected to ISH against ntl. Donor cells are marked in red. Arrows indicate the width of the notochord. f Quantifications display mean value, standard error of mean (SEM), and significance level of six independent embryos per experiment as indicated (*p value < 0.01; unpaired Student’s t test). g Ablation of cell rows in the ppl (5th GFP positive cell row) or at the ppl-notochord border (15th GFP positive cell row) in the Tg(gsc:GFP) fish line. Embryos were injected with a nuclear marker (Histone 2B-mCherry) and cell rows were ablated at 7 hpf using ultrashort laser pulses of a two-photon microscope. Embryos were raised to 10 hpf, fixed, and subjected to ISH against ntl. After ablation of a cell row in the ppl, embryos develop an elongated notochord (n = 11/11), whereas the notochord progenitor cells move slower and a gap appears towards the ppl in embryos with ablation of a cell row at the ppl–notochord border. Consequently, the trailing ntl expression domain remains shorter and broader (n = 6/10, white arrows). Yellow arrows mark the ablated cell rows. Scale bar: 100 µm

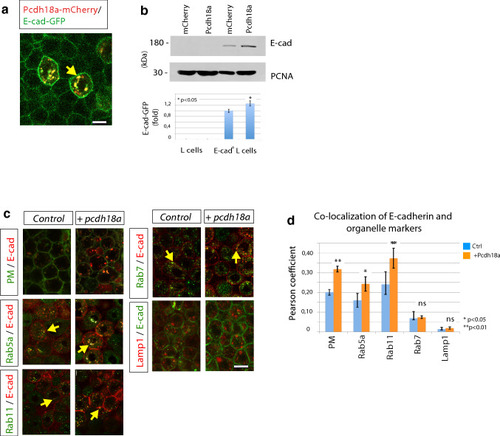
Pcdh18a regulates recycling of the E-cadherin. a Confocal image of zebrafish embryo at 5 hpf. Embryos were microinjected with 0.1 ng of mRNA for the indicated constructs and were imaged in vivo at 5 hpf. Pcdh18a is localized in the cell membrane and in endocytic vesicles, together with E-cadherin (E-cad). b Quantification of the E-cad levels in the Pcdh18a-transfected L cells. Equivalent amounts of lysates from murine L cells or stably E-cadherin-GFP-transfected L cells that had been transfected with Pcdh18a were Western blotted and probed with an anti-GFP antibody; the results showed a 26% increase in the E-cadherin-GFP protein levels after Pcdh18a transfection. The sample blot shows different parts of the same blot and PCNA was used as a loading control. The experiments were performed in independent triplicate (*p value < 0.05; unpaired Student’s t test). c Endocytic routing of E-cad at 50% epiboly. WT embryos and Tg(rab5-GFP), Tg(rab7-GFP), and Tg(rab11-GFP) stable transgenic embryos were microinjected with 0.1 ng of the mRNAs for the indicated constructs. Arrows indicate E-cad localization with Rab proteins and Lamp1-positive vesicles. d Pearson’s co-localization coefficient was calculated from 70 µm thick confocal stacks of five different embryos, each from c. The error bars represent the SEM and significance, as indicated (*p value < 0.05, **p value < 0.01; unpaired Student’s t test). Scale bar: 10 µm

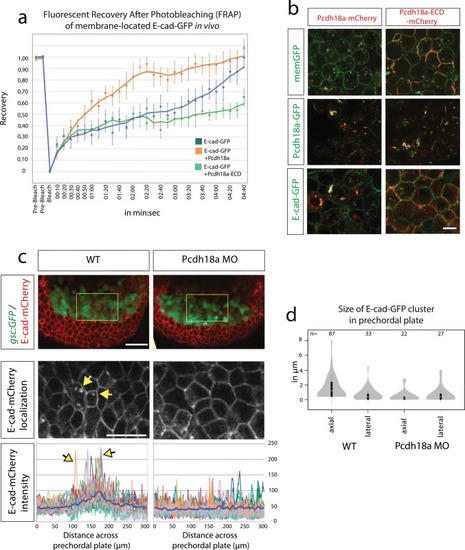
Pcdh18a domains and their importance with regard to endocytosis. a After photobleaching of a 3 µm spot at the cell membrane of E-cadherin-expressing embryos, new E-cadherin-GFP molecules moved into the bleached area from adjacent membrane regions, resulting in a return of 90% of fluorescence within 4 min 20 s (blue). Co-expression of Pcdh18a increased the speed of recovery and a 90% recovery was reached after 2 min 20 s (orange). Co-expression of Pcdh18a-ECD diminished FRAP of E-cadherin-GFP (green). Moving-average trendline was calculated with period 3. b Confocal images of zebrafish embryos at 5 hpf (50% epiboly). Embryos were injected with 0.1 ng mRNA of indicated constructs. In the deletion construct Pcdh18a-ECD, the intracellular domain was replaced by a mCherry domain. Pcdh18a-mCherry was localized to vesicles, whereas Pcdh18a-ECD-mCherrry was strongly localized to the cell membranes. Pcdh18a-GFP/Pcdh18a-mCherry and Pcdh18a-GFP/Pcdh18a-ECD-mCherry showed co-localization at the membrane and in vesicles suggesting homophilic interaction. Pcdh18a-mCherry/E-cadherin-GFP suggest heterophilic interaction. Pcdh18a-ECD-mCherry and E-cadherin-GFP were observed mainly at the membrane and did not co-localize suggesting that the intracellular domain of Pcdh18a is required for interaction and co-internalization with E-cad. Scale bar: 10 µm. cTg(gsc:GFP) embryos were injected with 0.1 ng of the e-cadherin-mCherry mRNA or co-injected with the pcdh18a MO (0.5 mM) and subjected to confocal microscopy analysis at 8 hpf. A cross section at the level of the ppl reveals enhanced E-cad localization at the plasma membrane and in endocytic vesicles, as shown by a projection of five fluorescence intensity histograms of five different embryos. Scale bar: 100 µm and 50 µm, respectively. d Bean plots shows the distribution, means, and standard deviations of the sizes of e-cadherin-GFP clusters in the lateral and axial mesodermal plate measured in 20 WT and pcdh18a morphant embryos

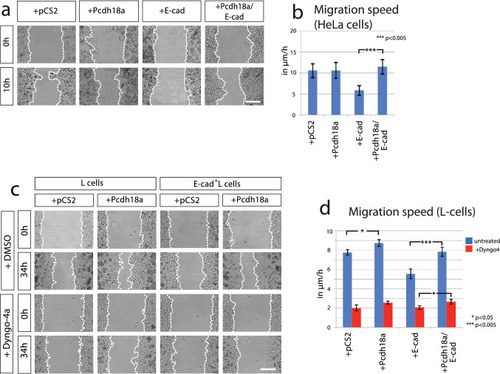
Pcdh18a affects E-cadherin dependent cell migration. a Wound-healing assay in HeLa cells. Cells were transfected with the indicated constructs and their migratory behaviour was monitored for 10 h after removing the insert. The dotted line shows limits of the confluent cell layer. b Quantification of the migration speed of HeLa cells. c Wound-healing assay in L cells. Cells were transfected with indicated constructs. After 24 h, L cells were treated with DMSO (1%) or Dyngo4a endocytosis inhibitor (1 µM in DMSO 1%). The migratory behaviour of cells was monitored in a time lapse for 34 h. d Quantification of the migration speed of L cells after blocking endocytosis. All wound-healing assays were conducted in independent triplicate, distances of the gap were measured at ten fixed positions. Mean values, SEM and significance are indicated (*p value < 0.05, ***p value < 0.005; unpaired Student’s t test). Scale bar: 200 µm

Directed cohort migration results in the formation of the rod-shaped notochord. a Visual rendering of the results of the simulations. See Supplementary Fig. S6 for the description of the cellular Potts model. b Embryos were microinjected with mRNAs for the indicated constructs (pcdh18a: 0.3 ng, e-cad: 0.4 ng, dyn2K44A: 0.2 ng). At 5 hpf, approximately 50 cells were grafted into the lateral embryonic margin of uninjected host embryos (n = 5). At 8 hpf, the migration and the directionality of the cell clusters were analysed. Animal pole was set to 0°, vegetal pole was set to 180°. Blue line indicates mean value of clonal coverage measured in ten different embryos per experiment and white lines indicate SEM. c Embryos from b were fixed and subjected to ISH for the lpm marker myf5. Horizontal cross sections revealed the formation of an ectopic rod-shaped structure of the Pcdh18a-positive clones in the lpm (yellow arrow). d Schematic summary of the function of the ppl in notochord morphogenesis. Pcdh18a/E-cadherin adhesion complexes (orange dots) increase cell adhesion within the ppl, leading to the cluster formation (left). In parallel, Pcdh18a controls endocytosis of E-cadherin adhesion complexes to allow fast cohort migration of the ppl cluster (right) to orchestrate intercalation of notochord cells. Scale bar: 100 µm

Acknowledgments
This image is the copyrighted work of the attributed author or publisher, and ZFIN has permission only to display this image to its users. Additional permissions should be obtained from the applicable author or publisher of the image. Full text @ Histochem. Cell Biol.