
- Title
-
Unifying Developmental Programs for Embryonic and Post-Embryonic Neurogenesis in the Zebrafish Retina
- Authors
- Xu, B., Tang, X., Jin, M., Zhang, H., Du, L., Yu, S., He, J.
- Source
- Full text @ Development
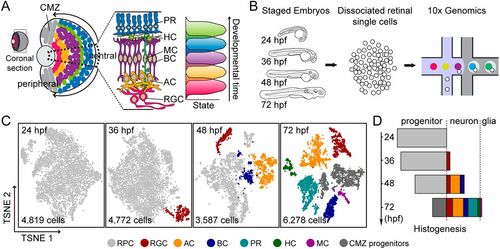
scRNA-seq of embryonic RPCs at different developmental stages. (A) Schematic showing that the zebrafish retina is composed of structurally and functionally radial retinal segments (dashed sector), which undergo the same developmental program in a sequential order (indicated by the arrows: from the center to the periphery). During the developmental program, RPCs give rise to different retinal types in the stereotyped order (indicated on the right). (B) Schematic workflow for scRNA-seq of staged embryonic RPCs using 10x Genomics technology. (C) t-SNE plots show the clustering of qualified retinal cells at different developmental stages (24, 36, 48 and 72 hpf). Different colors represent distinct cell types. The numbers of cells are indicated. (D) Plot showing proportions of distinct retinal cell types (indicated as different colors) over time, from the data in C. AC, amacrine cell; BC, bipolar cell; CMZ, ciliary marginal zone; HC, horizontal cell; MC, Müller glial cell; PR, photoreceptor cell; RGC, retinal ganglion cell. |
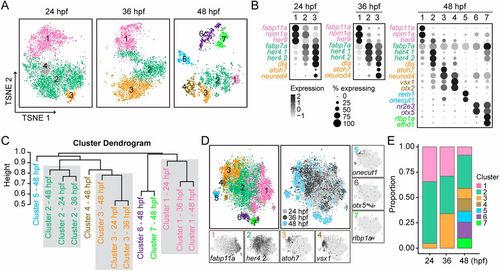
Defining cellular heterogeneity of embryonic RPCs. (A) Visualization of distinct clusters of different-staged embryonic RPCs using t-SNE. Cells are colored by their cluster assignments. Clusters are indicated by their corresponding labels. (B) Dot plots for the expressions of cluster-specific marker genes at different stages. Genes are colored by their cluster assignments. Circle size is proportional to the percentage of cells expressing the marker, and its intensity depicts the average transcript count within expressing cells. (C) Hierarchal clustering of distinct clusters of RPCs from different stages (Jaccard distance metric, average linkage). (D) t-SNE plots show distinct clusters from different embryonic stages after CCA alignment. The left big plot shows the cell distributions of aligned clusters; the right big plot shows the cell distributions of different embryonic stages. The expression patterns of cluster-specific marker genes are indicated in seven small plots. (E) The proportions of distinct clusters across different developmental stages. |
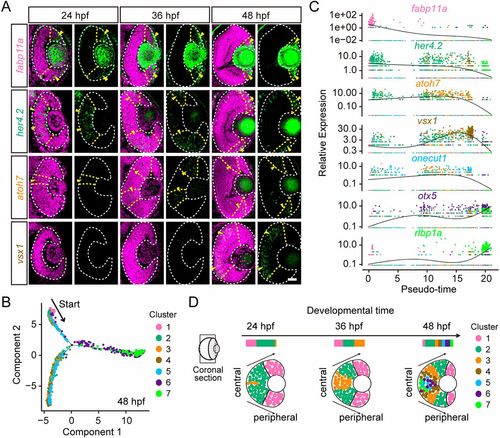
Temporal emergence of distinct cell clusters. (A) In situ hybridization images of cluster-specific marker genes (Clusters 1 to 4). Genes are colored by their corresponding clusters. The retina boundaries are indicated by the white dashed lines. Yellow arrowheads indicate the areas showing in situ signals (green). The nuclei are labeled by DAPI (magenta). Scale bar: 30 μm. (B) The pseudo-time trajectories of distinct clusters of 48-hpf RPCs. Cells are colored by their cluster assignments. (C) The expressions of cluster-specific marker genes across pseudo-time. Genes are colored by their cluster assignments. (D) Schematic summary of the evolution of different distinct clusters in a representative coronal retina section. The spatial distribution of individual cluster-specific marker genes suggests the emergence order of distinct developmental states from Clusters 1 to 7. |
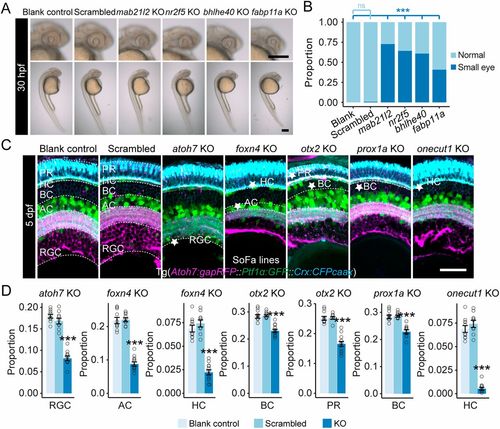
Individual developmental states represent various aspects of retinal development. (A) Representative images showing small eyes at 30 hpf as the result of disruption of Cluster 1-specific marker genes (mab21l2, nr2f5, bhlhe40 and fabp11a). Scale bars: 120 μm. (B) Plot showing the proportions of small eyes at 30 hpf as the result of disruption of individual Cluster 1-specific marker genes. ***P<0.001 (Fisher's exact test compared with the blank control). ns, no significant difference. (C) Confocal images of the retinas (coronal view) of SoFa fish lines at 5 dpf after disruption of Cluster 3- (atoh7, foxn4), Cluster 4- (otx2, prox1a) and Cluster 5- (onecut1) specific marker genes. The cell types that decreased significantly in cell number are labeled with stars. Scale bar: 30 μm. (D) Quantitative plots showing the proportions of cell types that decreased significantly in cell number from corresponding gene disruption groups in C (data are mean±s.e.m., data points are shown). ***P<0.001 (Wilcoxon test compared with the control groups). KO, knockout. |
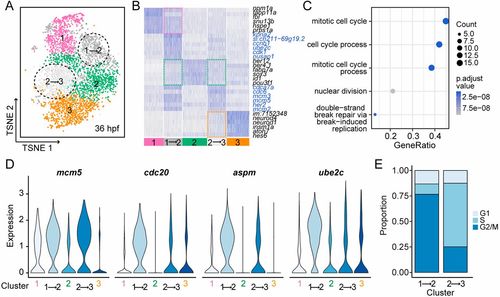
The transition between distinct states. (A) The t-SNE plot of 36-hpf RPCs. Cells are colored by their cluster assignments. Black dashed circles indicate the clusters that exhibit transitional gene expression pattern (termed as ‘transitional cluster’). (B) Heat-map for gene expression of the top six differentially expressed genes for each cluster in 36-hpf RPCs. Clusters 1- to 3-specific marker genes are depicted by pink, green and orange dashed squares, respectively. The genes highly expressed in transitional clusters are highlighted with blue. (C) Biological process enrichment analysis for genes highlighted by blue in B. The x-axis corresponds to the gene ratio quantifying the fraction of genes belonging to a particular biological process. The color code and size correspond to the corrected P-value and number of genes involved in the biological process, respectively. (D) Violin plots showing the expression levels of known S/G2/M markers in distinct and transitional clusters. (E) The proportions of cells within different cell cycle phases in transitional clusters. |
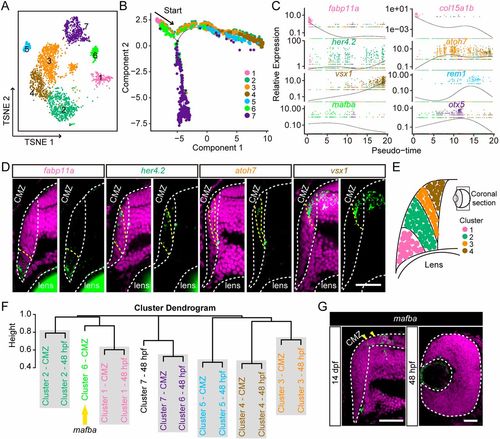
Conserved developmental states between embryonic and postembryonic retinogenesis. (A) Visualization of distinct clusters of 14-dpf CMZ progenitor cells using t-SNE. Cells are colored by their cluster assignments. Clusters are indicated by their corresponding labels. (B) The pseudo-time trajectories of distinct clusters of 14-dpf CMZ progenitor cells. Cells are colored by their cluster assignments. (C) The expressions of cluster-specific marker genes across pseudo-time. Genes are colored by their cluster assignments. (D) In situ hybridization images of Clusters 1- to 4-specific marker genes (fabp11a, her4.2, atoh7 and vsx1) in the CMZ of the retinas at 14 dpf. Genes are colored by their corresponding clusters. The CMZ boundaries are indicated by the white dashed lines. The areas showing in situ signals (green) are indicated by the region between yellow dashed lines. The nuclei are labeled by DAPI (magenta). Scale bar: 30 μm. (E) Schematic showing the spatial distribution of cells of Clusters 1 to 4 in the CMZ of the retina at 14 dpf. (F) Hierarchal clustering of distinct clusters from embryonic (48-hpf RPCs) and postembryonic (14-dpf CMZ progenitor cells) stages (Jaccard distance metric, average linkage). Yellow arrow indicates the cluster with specific expression of mafba. (G) In situ hybridization images of mafba in 48-hpf RPCs and the CMZ progenitor cells of 14-dpf retina. The 48-hpf retina and the CMZ of 14-dpf retina are indicated by the white dashed lines. Yellow arrowheads indicate the areas showing in situ signals (green). Scale bars: 30 μm. |
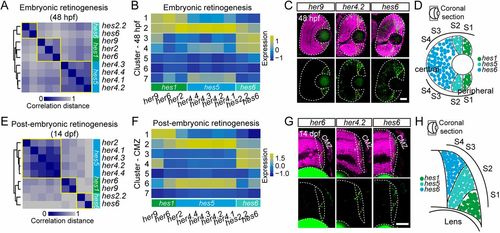
Embryonic RPCs and postembryonic RSCs share similar expression dynamics of hes family genes. (A) Gene-to-gene correlation of different hes/her genes in 48-hpf RPCs. Yellow squares depict different hes clusters. (B) Heat-map showing the distribution of hes/her genes across different distinct clusters of 48-hpf RPCs. (C) In situ hybridization images of her9 (hes1), her4.2 (hes5) and hes6 in the coronal view of the 48-hpf retinas. The retina boundaries are indicated by the white dashed lines. The areas showing in situ signals (green) are indicated by the region between yellow dashed lines. The nuclei are labeled by DAPI (magenta). Scale bar: 30 μm. (D) Schematic showing the evolution of her9 (hes1), her4.2 (hes5) and hes6 across distinct clusters at a coronal view of the embryonic retina. The emergence order of hes/her family genes is her9 (hes1), her4.2 (hes5) and hes6. (E) Gene-to-gene correlation of different hes/her genes in 14-dpf CMZ progenitor cells. Yellow squares depict different hes clusters. (F) Heat-map showing the distribution of hes/her genes across different distinct clusters of 14-dpf CMZ progenitor cells. (G) In situ hybridization images of her6 (hes1), her4.2 (hes5) and hes6 in the coronal view of the 14-dpf CMZ. The retina boundaries are indicated by the white dashed lines. The areas showing in situ signals (green) are indicated by the region between yellow dashed lines. The nuclei are labeled by DAPI (magenta). Scale bar: 30 μm. (H) Schematic showing the evolution of her6 (hes1), her4.2 (hes5) and hes6 across distinct clusters at a coronal view of the CMZ. The emergence order of hes/her family genes is her6 (hes1), her4.2 (hes5) and hes6. |
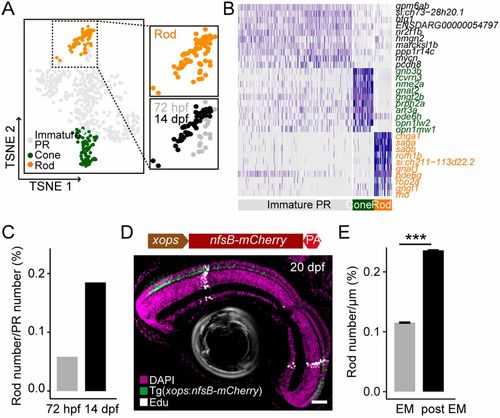
Distinct fate outputs of embryonic RPCs and postembryonic RSCs. (A) Cell clusters of PR subtypes that were obtained from the pool of single cells of 72-hpf retinas and GFP-positive cells of 14-dpf retinas of Tg(PCNA:GFP). Cells are colored by their cluster assignments. Rod cluster is enlarged on the right, and it is shown by stages of 72 hpf (gray) and 14 dpf (black). (B) Heat-map of gene expression showing the top 10 differentially expressed genes for each distinct cell cluster of PRs. Specific marker genes of cone and rod are depicted by green and orange, respectively. (C) Bar plot showing the ratios of rods in total PRs of 72 hpf and 14 dpf. (D) Image of EdU staining of the 20-dpf retina of the Tg(xops:nfsB-mCherry) fish after a pulse of EdU at 5 dpf. A schematic of plasmid design for Tg(xops:nfsB-mCherry) is provided above the image. Scale bar: 30 μm. (E) Bar plot showing the density of rods from embryonic (EM) and postembryonic (post EM) retinogenesis. ***P<0.001 (Wilcoxon test). Data are mean±s.e.m. n=86 sections from six retinas. |