
- Title
-
SCO-Spondin Defects and Neuroinflammation Are Conserved Mechanisms Driving Spinal Deformity across Genetic Models of Idiopathic Scoliosis
- Authors
- Rose, C.D., Pompili, D., Henke, K., Van Gennip, J.L.M., Meyer-Miner, A., Rana, R., Gobron, S., Harris, M.P., Nitz, M., Ciruna, B.
- Source
- Full text @ Curr. Biol.

Idiopathic-like Scoliosis in dmh4/+ Zebrafish Is Associated with Compromised CSF Flow in the Absence of Obvious Motile Cilia Defects (A and B) Calcein stains of wild-type (A and A’; N = 3; n = 24) and dmh4/+ (B and B’; N = 3; n = 29) larva at 13 dpf (6.5 mm standard length). Note the onset of spinal curvatures in dmh4/+ zebrafish (arrowheads) in the absence of congenital vertebral malformations. Scale bars represent 500 μm. (C–F) Lateral (C and E) and dorsal (D and F) projections of three-dimensional microCTs for adult wild-type (C and D) and dmh4/+ (E and F) fish. (G–J) Quantification of curve severity, direction, and position along dorsal-ventral (G) and mediolateral (I) axes. Dashed lines indicate a Cobb angle of 0°, as per a wild-type spine. Data points for male and female fish are indicated as squares and circles, respectively. Combined total Cobb angle in dorsal-ventral (H; p = 0.4) and medio-lateral (J; p = 0.67) axes for males and females is shown. (K and L) Representative SEM images of wild-type (K; N = 3; n = 7) and dmh4/+ (L; N = 3; n = 10) bisected brains at 3 months of age. Scale bars represent 200 μm. Squares indicate location of higher magnification images (K’ and L’). Scale bars represent 5 μm. (M–O) Representative images (M and N) and quantification (O) of bulk CSF movement along the spinal cord of 20-dpf wild-type (M; n = 18) and dmh4/+ (N; n = 18) larva, 2 h after injection of reporter dye into brain ventricles. p = 0.0038. Arrowheads indicate movement of dye. Scale bars represent 1 mm. See also Figure S1. |

Functional Genetic Studies Link Scospondin with dmh4 Mutant Phenotypes (A) dmh4 mutation mapping graph for chromosome 24. Region of linkage (gray box) with locations of CU929145.1 (blue arrow) and sspo (yellow arrow) indicated. (B) Schematic depicting position and sequence of sspo c.2570G > T variant and CRISPR exon 17 sgRNA. (C and D) Following embryonic injection of Cas9 and sspo exon 17 sgRNA, most F0 fish with mosaic sspo mutations appear normal (C), whereas some develop spinal curvatures (n = 6/181; D). Scale bars represent 2 mm. (E) Schematic representation of the location and predicted functional outcomes for sspo mutations reported in this paper. SCORs, SCO-spondin repeat domains; TSR, thrombospondin type 1 repeat; vWDs, von Willebrand domains; LDLrA, low density lipoprotein receptor type A domain. (F–I) Lateral views of sspo mutant embryos at 3 dpf, demonstrating CTD phenotypes associated with dmh4/dmh4 (F), hsc105/hsc105 (G), dmh4/hsc105 (H), and hsc107/hsc107 (I) allelic combinations. Scale bars represent 1 mm. (J) Representative photo of an adult sspodmh4/+ zebrafish with obvious scoliosis. Scale bar represents 2 mm. (K) Representative photo of an adult sspohcs107/+ zebrafish, demonstrating that sspo loss-of-function mutations introduced in cis with the dmh4 c.2570G > T variant can suppress dominant scoliosis phenotypes. Scale bar represents 2 mm. See also Figure S2. PHENOTYPE:
|

Idiopathic-like Scoliosis Is Associated with Irregularities in Sspo Localization (A–I) Whole-mount immunostaining was performed on 2-dpf embryos using an antibody raised against bovine Reissner’s substance. Whole embryos were imaged using a LSM710 confocal microscope (Zeiss). Z stacks were collected and processed using ImageJ. Maximum intensity projections are shown. Lateral mounts are anterior to the left. FO, flexural organ; FP, floorplate; SCO, subcommissural organ. Scale bars represent 20 μm. The SCO (A–C) and FO (D–F), which secrete Sspo, are immunoreactive in all embryos at 2 dpf. Sspo aggregation into RF is clearly visible within the brain and spinal cord of wild-type (A, D, and G; N = 3; n = 9) and sspodmh4/+ embryos (B, E, and H; N = 3; n = 9) but absent in sspodmh4/dmh4 embryos (C, F, and I; N = 3; n = 12). Instead, sspodmh4/dmh4 mutants display abnormal accumulation of Sspo within cells of the FO (asterisks; F) and FP (arrowheads; I). Similar intracellular accumulations of Sspo can also be observed in sspodmh4/+ embryos (E and H). (J–O) Dorsal whole-mount images of brains dissected from juvenile (21-dpf) zebrafish immunostained for Sspo. Positions of the SCO (asterisk) and RF (arrowhead) are indicated. Images were acquired using a Zeiss V16 Axio Zoom compound fluorescent microscope. Anterior to the left is shown. In wild-type animals (J), Sspo is localized to both SCO and RF (N = 3; n = 8). sspodmh4/+ brains (K) exhibit ectopic Sspo accumulation around the SCO, and RF staining is not detected (N = 2; n = 8). ptk7ahsc9/hsc9 (L) mutants demonstrate irregular Sspo accumulations throughout the brain, most notably in the anterior region near the SCO as well as in the fourth ventricle (N = 1; n = 7). Juvenile F0 sspo sgRNA-injected fish that appear phenotypically normal (M) exhibit clear Sspo staining within the SCO and RF (N = 2; n = 5). However, RF staining is absent in all scoliotic F0 sspo sgRNA-injected animals (N; N = 2; n = 8). ccdc151ts272/ts272 (O) mutants demonstrate pronounced Sspo accumulations anterior to the SCO within the third ventricle and disrupted RF staining (N = 1; n = 5). Scale bars represent 500 μm. (P–S) Maximum-intensity Z projections for stacks of dorsal confocal images taken through brains dissected from juvenile (21-dpf) zebrafish immunostained for glutamylated tubulin (magenta) and Sspo (green). Higher resolution micrographs highlight normal Sspo localization in wild-type animals (P; N = 4; n = 11) and the irregular distribution of Sspo in sspodmh4/+ (Q; N = 2; n = 7), ptk7ahsc9/hsc9 (R; N = 9; n = 35), and ccdc151ts272/ts272 (S; N = 1; n = 4) mutant fish. Normal positions of the SCO (asterisk) and RF (arrowhead) are indicated. Images were acquired using a Zeiss LSM710 confocal microscope and processed using ImageJ. Anterior is to the left. Scale bars represent 100 μm. (T–V) Single confocal images isolated from Z projections (above) demonstrate Sspo condensation into RF in wild-type animals (T) but irregular ventricular accumulation of Sspo and the absence of a defined RF in both ptk7ahsc9/hsc9 (U) and ccdc151ts272/ts272 (V) scoliotic juvenile fish. Scale bars represent 50 μm. See also Figure S3. EXPRESSION / LABELING:
PHENOTYPE:
|
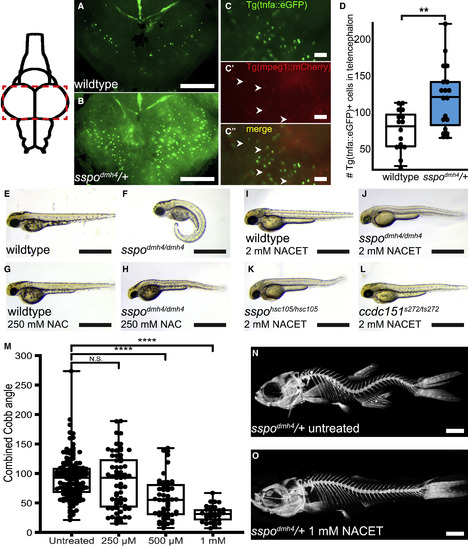
Chemical Suppression of CTD Phenotype Identifies NACET as a Potent Inhibitor of Severe Spinal Curve Progression (A–D) Evidence of neuroinflammation in scoliotic sspodmh4/+ fish. (A–C) Dorsal whole-mount images of brains dissected from juvenile (21-dpf) wild-type (A) and scoliotic sspodmh4/+ (B and C) zebrafish expressing the TgBAC(tnfa:eGFP) reporter, revealing an increase of TgBAC(tnfa:eGFP) activity in the telencephalon of sspodmh4/+ animals. TgBAC(tnfa:eGFP) expression does not co-localize with Tg(mpeg1:mCherry)-positive macrophages (arrows in C). Images were acquired using a Zeiss V16 Axio Zoom compound fluorescent microscope. Rostral is down. Scale bars represent 200 μm (A and B) and 50 μm (C). (D) Quantification of TgBAC(tnfa:eGFP)+ cells in the telencephalon of 21-dpf animals reveals a significant increase in sspodmh4/+ fish (∗∗p = 0.0069). (E–L) Lateral photos of 53-hpf zebrafish embryos demonstrating representative axial morphogenesis phenotypes. Wild-type (E) embryos exhibit a straight body axis. sspodmh4/dmh4 (F) embryos demonstrate characteristic curly tail down (CTD) phenotype. Treatment of sspodmh4/dmh4 mutants at 27 hpf with 250 mM NAC in 1% DMSO (H) can suppress CTD defects. Similarly, treatment with 2 mM NACET in 1% DMSO can suppress ventral tail curvatures in sspodmh4/dmh4 (J), sspohsc105/hsc105 (K), and ccdc151ts272/ts272 (L) mutant embryos. In contrast, treatment of wild-type embryos with 250 mM NAC (G) or 2 mM NACET (I) in 1% DMSO does not affect axis morphogenesis. Scale bars represent 1 mm. (M–O) NACET treatment of juvenile sspodmh4/+ zebrafish can suppress severe spinal curve progression. (M) Box and whisker plot for quantified combined Cobb angles measured in untreated control sspodmh4/+ fish (n = 138) and sspodmh4/+ fish treated with 250 μM (n = 65), 500 μM (n = 55), and 1 mM (n = 33) of NACET. A significant reduction in curve severity was observed for fish treated with both 500 μM and 1 mM NACET concentrations (∗∗∗∗p < 0.0001; two-tailed t test). (N and O) Representative images of Alizarin Red stained untreated (N) and 1 mM NACET-treated (O) sspodmh4/+ fish are shown. Scale bars represent 1 mm. See also Figure S4 and Tables S1 and S2. EXPRESSION / LABELING:
PHENOTYPE:
|