Wnt signaling is involved in the maintenance of ependymal motile cilia in zebrafish embryos.
a Transmission electron microscopy (TEM) of the spinal cords (SCs) of zebrafish embryos at 2 dpf. Arrowhead indicates a motile cilium with the 9 + 2 microtubule configuration, which is magnified to the right. Scale bar = 1 μm. b Immunofluorescence (IF) staining of an embryo at 1 dpf with anti-acetylated-α-tubulin antibody. Dorsal view anterior to the left. Arrowheads represent motile cilia. Scale bar = 20 μm. c, d IF staining of sonic-you (syut4) mutant embryos at 2 dpf with anti-acetylated-α-tubulin antibody. Dorsal view anterior to the left (c). d The cross-section image of the SC ventral to the bottom. Arrowheads represent motile cilia. Scale bars = 20 μm. e Embryos were treated with DAPT (50 μM) at 34–48 hpf and IF stained with anti-acetylated-α-tubulin antibody. Dorsal view anterior to the left. Arrowheads represent motile cilia. Scale bar = 20 μm. f Embryos were co-microinjected with wnt4b MO and wnt11 MO (wnt4b/11 MO) alone or along with wnt4b mRNA and wnt11 mRNA (wnt4b/11 mRNA), and IF stained at 2 dpf with anti-acetylated-α-tubulin antibody. Arrowheads represent motile cilia. Dorsal view anterior to the left. Scale bar = 20 μm. CO: Control. g Quantification of the number of cilia per frame in embryos in f. Data are presented as mean ± SD. **P < 0.01 and ****P < 0.0001 by one-way ANOVA with Tukey’s honest significant difference (HSD) post hoc test (control morphants: n = 12 embryos; wnt4b/11 double morphants: n = 9 embryos; wnt4b/11 double morphants + wnt4b/11 mRNA: n = 9 embryos; one frame per embryo). h A cross-section images of the SCs of control morphants and wnt4b/11 double morphants at 2 dpf probed with foxj1a riboprobes ventral to the bottom. Arrowheads represent ECs. Scale bar = 20 μm. CO: Control. i RNAs were extracted from each group (20 embryos in h) at 2 dpf and levels of foxj1a mRNAs were assessed by qPCR. Mean ± SD. ****P < 0.0001 by two-tailed unpaired Student’s t test from four biological replicates (three technical replicates each). j A cross-section image of the SC of a WT embryo at 2 dpf probed with fzd7b riboprobes ventral to the bottom. Arrowhead represents ECs. Scale bar = 15 μm. k Embryos were microinjected with control MO, fzd7b MO or fzd7b MO + fzd7b mRNA, and IF stained at 2 dpf with anti-acetylated-α-tubulin antibody. Arrowheads represent motile cilia. Dorsal view anterior to the left. Scale bar = 20 μm. CO: Control. l Quantification of the number of cilia per frame in embryos in k. Mean ± SD. ****P < 0.0001 by one-way ANOVA with Tukey’s HSD post hoc test (control morphants: n = 21 embryos; fzd7b morphants: n = 21 embryos; fzd7b morphants + fzd7b mRNA: n = 18 embryos; one frame per embryo). mTg(hsp70l:dkk1b-GFP) embryos at 24 hpf were subjected to heat shock at 39 °C for 1 h, and IF stained at 2 dpf with anti-acetylated-α-tubulin antibody. Arrowheads represent motile cilia. Dorsal view anterior to the left. Scale bar = 20 μm. n, o Embryos were treated with IWR-1 (10 μM) at 8–48 hpf and IF stained with anti-acetylated-α-tubulin antibody only (n) or double immunostained with anti-acetylated-α-tubulin antibody and anti-γ-tubulin antibody (o) at 2 dpf. Arrowheads represent motile cilia. Dorsal view anterior to the left. The boxed areas in o are magnified in the respective lower panels. Scale bar = 20 μm.
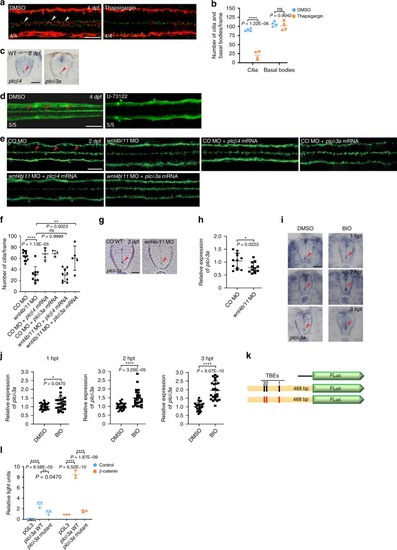
<italic>plcδ3a</italic> is a target gene of Wnt signaling and plays an important role in the maintenance of ependymal motile cilia.
a DMSO (vehicle control) or thapsigargin (4 nl at 5 μM) was microinjected into the hindbrain ventricles of zebrafish larvae at 4 dpf and the larvae were double immunostained with anti-acetylated α-tubulin antibody (red) and anti-γ-tubulin antibody (green) 4 h after injection. Arrowheads indicate motile cilia. Dorsal view anterior to the left. Scale bar = 20 μm. b Quantification of the number of cilia and basal bodies per frame in embryos in a. Mean ± SD. ****P < 0.0001 by two-tailed unpaired Student’s t test (n = 4 embryos per group; one frame per embryo). ns, not significant. c Embryos at 2 dpf were probed with plcβ4 or plcδ3a riboprobes and their SCs were cross-sectioned. Images are oriented ventral to the bottom. Arrowheads represent ECs. Scale bar = 20 μm. d DMSO (vehicle control) or U-73122 (4 nl at 10 μM) was microinjected into the hindbrain ventricles of zebrafish larvae at 4 dpf and the larvae were IF stained with anti-acetylated α-tubulin antibody 4 h after microinjection. Dorsal view anterior to the left. Scale bar = 20 μm. e Control morphants or wnt4b/11 double morphants were microinjected with plcβ4 or plcδ3a mRNA and immunostained with anti-acetylated α-tubulin antibody at 2 dpf. Arrowheads represent motile cilia. Dorsal view anterior to the left. Scale bar = 20 μm. f Quantification of the number of motile cilia per frame in embryos in e. Mean ± SD. **P < 0.01 and ****P < 0.0001 by one-way ANOVA with Tukey’s HSD post hoc test (control morphants: n = 12 embryos; wnt4b/11 double morphants: n = 9 embryos; control morphants + plcβ4 mRNA: n = 4 embryos; control morphants + plcδ3a mRNA: n = 3 embryos; wnt4b/11 double morphants + plcβ4 mRNA: n = 9 embryos; wnt4b/11 double morphants + plcδ3a mRNA: n = 5 embryos; one frame per embryo). ns: not significant. g Control morphants or wnt4b/11 double morphants at 2 dpf were probed with plcδ3a riboprobes and their SCs were cross-sectioned. Images are oriented ventral to the bottom. Arrowheads point to ECs. Scale bar = 20 μm. h RNAs were extracted from each group (20 embryos in g) at 2 dpf and levels of plcδ3a mRNA were assessed by qPCR. Mean ± SD. *P < 0.05 by two-tailed unpaired Student’s t test from four biological replicates (three technical replicates each). CO: Control. i Embryos at 45 hpf were treated with DMSO or BIO (5 μM) for 1–3 h and probed with plcδ3a riboprobes, and their SCs were sectioned. Images are oriented ventral to the bottom. hpt: hours post-treatment. Arrowhead indicates ECs. Scale bar = 20 μm. j Upon BIO treatment, RNAs were extracted from each group (20 embryos in (i)) and levels of plcδ3a mRNAs were assessed by qPCR. Mean ± SD. *P < 0.05 and ****P < 0.0001 by two-tailed unpaired Student’s t test from three biological replicates (eight technical replicates each). k Schematic of the plcδ3a promoter-firefly luciferase construct used in the luciferase reporter assay. Black rectangles represent three (1–3) Tcf binding elements (TBEs) and red rectangles TBEs with deletions. l HEK 293T cells were transfected with WT or mutant plcδ3a promoter-firefly luciferase constructs and Renilla luciferase plasmid with or without β-catenin plasmid, and processed for dual luciferase assay. Relative Light Units: firefly luciferase activity/Renilla luciferase activity. **P < 0.01 and ****P < 0.0001 by one-way ANOVA with Tukey’s HSD post hoc test (n = 3 culture replicates per group; each culture was assayed three times).
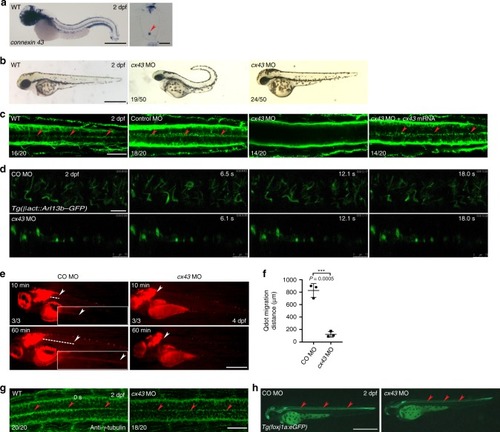
Cx43 is implicated in the maintenance of ependymal motile cilia.
a WISH of a WT embryo at 2 dpf with cx43 riboprobes (left). Lateral view anterior to the left. Right panel shows the cross-section image of the SC ventral to the bottom. Arrowhead indicates ECs. Scale bars = left: 650 μm; right: 20 μm. b Embryos at one-cell stage were microinjected with cx43 MO and imaged at 2 dpf. Lateral view anterior to the left. Scale bar = 650 μm. c Embryos at one-cell stage were microinjected with either control MO or cx43 MO or cx43 MO + mouse Cx43 mRNA, and IF stained with anti-acetylated α-tubulin antibody at 2 dpf. Arrowheads represent spinal motile cilia. Dorsal view anterior to the left. Scale bar = 20 μm. dTg(bactin2:Arl13b-GFP) embryos expressing GFP in motile cilia were microinjected at one-cell stage with either control (CO) MO or cx43 MO and subjected to time-lapse imaging for 2 min (6.7 frames s−1) with an intravital multiphoton microscope. Dorsal view anterior to the left. Scale bar = 7.5 μm. e Embryos at one-cell stage were microinjected with control MO or cx43 MO and Qdots were microinjected into the hindbrain ventricles of larvae at 4 dpf, which were then imaged at 10 min and 60 min after the microinjection. Dashed lines indicate migration of Qdots. Arrowheads mark the caudal end of Qdot flow. Lateral view anterior to the left. Scale bar = 650 μm. Insets represent magnifications of the dotted areas. CO: Control. f Quantification of Qdot migration distance in the larvae shown in d. Mean ± SD. ***P < 0.001 by two-tailed unpaired Student’s t test (n = 3 larvae per group). g Embryos at one-cell stage were microinjected with either control MO or cx43 MO and immunostained with anti-γ-tubulin antibody at 2 dpf. Arrowheads indicate motile cilia. Dorsal view anterior to the left. Scale bar = 20 μm. hTg(foxj1a:eGFP) embryos expressing GFP in ECs were microinjected with either control MO or cx43 MO and imaged at 2 dpf. Arrowheads represent spinal ECs. Dorsal view anterior to the left. Scale bar = 650 μm.
The electrochemical coupling function of Cx43 plays an important role in the maintenance of ependymal motile cilia.
a Domain structure of Cx43. TM, transmembrane. b, d Embryos at one-cell stage were microinjected with control MO, cx43 MO or cx43 MO + mRNA encoding mouse Cx43 lacking the C-terminal domain (b) or cx43 MO + mRNA that encodes mouse mutant Cx43 lacking the channel function (d), and IF stained with anti-acetylated α-tubulin antibody at 2 dpf. Arrowheads represent motile cilia. Dorsal view anterior to the left. Scale bar = 20 μm. c, e Quantification of the number of ependymal motile cilia in b, d, respectively. Mean ± SD. **P < 0.01 and ****P < 0.0001 by one-way ANOVA with Tukey’s HSD post hoc test: cn = 20 embryos per each group; en = 10 embryos per each group except cx43 MO + cx43 T154A mRNA (n = 7 embryos). ns, not significant. f Embryos were treated with carbenoxolone (1 μM) at 18–48 hpf and immunostained with anti-acetylated α-tubulin antibody at 2 dpf. Arrowheads point to motile cilia. Dorsal view anterior to the left. Scale bar = 20 μm. g Embryos at one-cell stage were microinjected with cx43 MO, treated with either DMSO (vehicle control) or BIO (5 μM) at 12–48 hpf, and IF stained with anti-acetylated α-tubulin antibody at 2 dpf. Arrowheads represent motile cilia. Dorsal view anterior to the left. Scale bar = 20 μm. h Quantification of the number of ependymal motile cilia per frame in embryos in g. Mean ± SD. ****P < 0.0001 by two-tailed unpaired Student’s t test (cx43 MO + DMSO: n = 18 embryos; cx43 MO + BIO: n = 20 embryos; one frame per embryo). iTg(foxj1a:GCaMP6s) embryos expressing a calcium indicator (GCaMP6s) in ECs were microinjected at one-cell stage with control MO or cx43 MO, and cx43 morphants were treated with BIO (5 μM) at 12–48 hpf. Subsequently, they were subjected to time-lapse imaging for 3 min (20 frames/min) with a confocal microscope. Dorsal view anterior to the left. Scale bar = 20 μm. j The GFP fluorescence intensity in ten cells (1–10) in each embryo in i was individually assessed at 0 (F0), 60 (F60), 120 (F120) and 180 s (F180), and presented as F60/F0, F120/F0 and F180/F0.
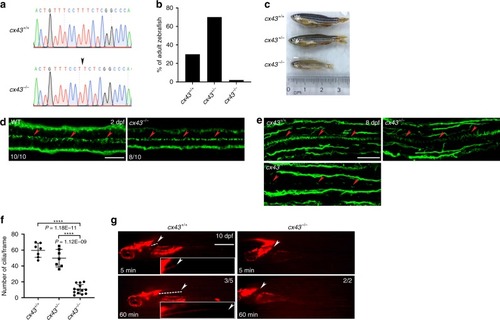
c<italic>x43</italic> null zebrafish have reduced motile cilia in ECs.
a Electropherograms of the target sequences of the cx43 gDNA in WT and cx43−/− zebrafish. Arrow indicates the deletion of the T nucleotide. b Zebrafish (n = 71) at 2 months post-fertilization (mpf) from mating of cx43+/− zebrafish were genotyped for cx43. c Images of 3 mpf zebrafish with the indicated cx43 genotype. d WT or cx43−/− embryos at 2 dpf were immunostained with anti-acetylated-α-tubulin antibody, imaged with a confocal microscope and genotyped for cx43. Arrowheads represent motile cilia. Dorsal view anterior to the left. Scale bar = 20 μm. e Larvae at 8 dpf from mating of cx43+/− zebrafish were cut into cranial and caudal halves. The cranial half was used for cx43 genotyping, and the caudal half was coronally sectioned at a thickness of 14 μm and then processed for IF staining with anti-acetylated-α-tubulin antibody. Arrowheads represent motile cilia. Dorsal view anterior to the left. Scale bar = 30 μm. f Quantification of the number of cilia per frame in embryos in e. Mean ± SD. ****P < 0.0001 by one-way ANOVA with Tukey’s HSD post hoc test (cx43+/+ = 7 embryos; cx43+/− = 7 embryos; cx43−/− = 13 embryos; one frame per embryo). g Qdots were microinjected into the hindbrain ventricles of WT or cx43−/− zebrafish larvae at 10 dpf and then imaged at 5 and 60 min after the microinjection. Dashed lines indicate passive migration of Qdots. Arrowheads mark the caudal end of Qdot flow. Lateral view anterior to the left. Scale bar = 1 mm. Insets represent magnifications of the dotted areas.
<italic>Cx43</italic> null mice have reduced motile cilia in ECs.
a, b The SCs of P1 pups with the indicated Cx43 genotype were cross-sectioned, double immunostained with anti-Cx43 and anti-ARL13B antibodies (a) or anti-Phospho-Cx43 (Ser386) antibody (b), and counterstained with DAPI. Asterisks indicate the central canal (CC). Images are oriented ventral to the bottom. Scale bars = 20 μm. c, d Quantifications of motile cilia per section in embryos in a and Cx43 signals per section in embyos in b. Mean ± SD. ***P < 0.001 and ****P < 0.0001 by one-way ANOVA with Tukey’s HSD post hoc test (n = 3 mice per group; one frame per mouse). ns, not significant. e TEM of the SCs of P1 pups with the indicated Cx43 genotype. Arrowheads indicate cross-sectioned motile cilia protruding to the CC and arrow marks a cilium-like structure embedded in an EC. Regions marked by arrowheads or arrow are magnified in the respective lower panels. f The human spinal cord at C1 level from a cadaver was stained with anti-Cx43 and anti-acetylated-α-tubulin antibodies. The boxed areas are magnified in the respective lower panels. Arrowhead denotes staining of Cx43 and arrow motile cilia. Scale bar = 100 μm. g A proposed model for the maintenance of ependymal motile cilia by the Wnt-PLC-IP3-Connexin-Ca2+ axis.
Acknowledgments
This image is the copyrighted work of the attributed author or publisher, and
ZFIN has permission only to display this image to its users.
Additional permissions should be obtained from the applicable author or publisher of the image.
Full text @ Nat. Commun.
Your Input Welcome
Thank you for submitting comments. Your input has been emailed to ZFIN curators who may contact you if
additional information is required.
Oops. Something went wrong. Please try again later.