FIGURE SUMMARY
Title

A unified nomenclature for vertebrate olfactory receptors

Authors
Olender, T., Jones, T.E.M., Bruford, E., Lancet, D.
Source
Full text @ BMC Evol. Biol.

The MMS algorithm. A diagram illustrating the workflow of hierarchical symbol assignment with the MMS algorithm. After identification of the full OR repertoire in a given species, all vs all BLASTP similarity matrices are generated against the OR repertoires of human and other mammals whose repertoires have been classified. The classification criteria (highlighted in the left-hand yellow box), numbered 1–5, are applied in a stepwise fashion: genes that fail to pass the cutoff in step 1 are passed to step 2, and so on. Symbols are assigned based on the best hits as shown in the middle (blue) box. Examples of cow OR symbols at each classification step are shown in the right-hand (pink) box

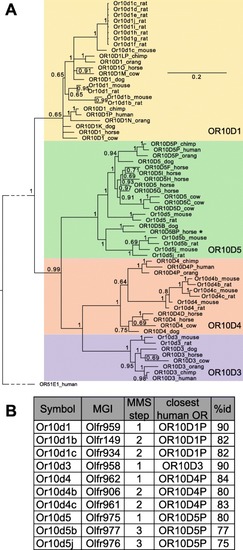
OR subfamily 10D classification. a Bayesian phylogeny of subfamily 10D members. Human OR51E1 was used as the outgroup. The tree is displayed with posterior probabilities on the branch nodes. Scale bar represents the number of amino acid changes per site. The dotted line indicates that that the outgroup branch has been compressed for display purposes; the unmodified branch length can be viewed in Additional file 5. The subfamily member clades are each given a different background colors. OR10D1: yellow, OR10D3: purple, OR10D4: orange, and OR10D5: green. An asterisk denotes a gene that was classified manually based on the strength of phylogenetic evidence placing it within that clade. Automated symbol assignment using the MMS algorithm is concordant with the clades resolved by phylogenetic analysis. b Details of the classification of mouse OR10D genes. For each gene, the table shows the symbol suggested using the MMS algorithm alongside the MMS classification step in which it was assigned (see Fig. 1), the current MGI symbol, and its closest human OR gene (by % identity)

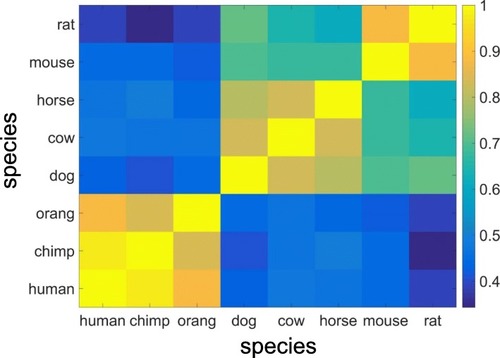
Correlation among the mammalian OR repertoires. The Pearson correlation matrix was calculated using the number of members of each subfamily for each pair of species (Additional file 2). Only subfamilies that are shared by at least 2 mammals (378 subfamilies) were used in the analysis. As expected, the OR repertoires of closely related species show a higher correlation than those of less closely related species

A three-way comparison of human, chimpanzee and orangutan OR symbols. a. Examples of how one can use the nomenclature to compare the primate OR repertoires. Symbols that are found in all three primates are in orange boxes, missing symbols are in green boxes (putative deletions), and symbols that are duplicated in one of the species are in dark orange (putative duplications). The “P” suffix stands for pseudogene. The “W” suffix in the OR8B1W symbol indicates that this is one of many orthologs of OR8B1. Additional OR8B1 orthologs with suffixes B-V in their symbols were identified in non-primate species. b. A Venn diagram summarizing the comparison result. Numbers in white refer to OR gene count in human

Phylogenetic analysis of zebrafish ORs. A neighbor-joining tree of all zebrafish OR genes and pseudogenes with up to 2 frame-disruptions, mouse OR representatives from families 55 and 6 (the mouse Or55b3 and Or6c75, indicated by red asterisks) and the bovine rhodopsin sequence as an outgroup. The tree is color-coded by the OR family classification where the OR family numbers are indicated next to the corresponding evolutionary branch (see Additional file 3: Table S2 for the relationship between family numbers and classes). All OR families’ main branches are supported by bootstrap values > 90, except for OR family 60 and 40 as their location within the class clade was less certain (bootstrap values of 31 and 77, respectively). The 2 OR families that are shared with mammals are highlighted in yellow

Acknowledgments
This image is the copyrighted work of the attributed author or publisher, and ZFIN has permission only to display this image to its users. Additional permissions should be obtained from the applicable author or publisher of the image. Full text @ BMC Evol. Biol.