
- Title
-
The metalloproteinase Papp-aa controls epithelial cell quiescence-proliferation transition
- Authors
- Liu, C., Li, S., Noer, P.R., Kjaer-Sorensen, K., Juhl, A.K., Goldstein, A., Ke, C., Oxvig, C., Duan, C.
- Source
- Full text @ Elife

ZFIN is incorporating published figure images and captions as part of an ongoing project. Figures from some publications have not yet been curated, or are not available for display because of copyright restrictions. EXPRESSION / LABELING:
PHENOTYPE:
|
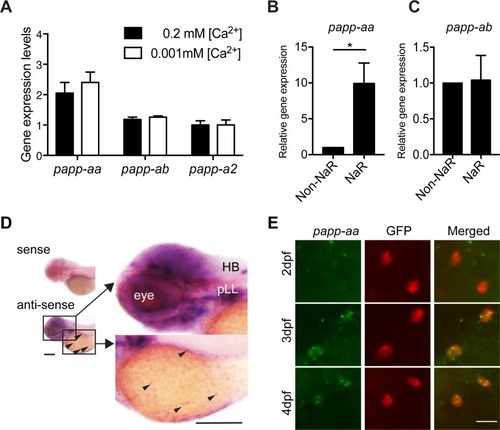
( EXPRESSION / LABELING:
PHENOTYPE:
|
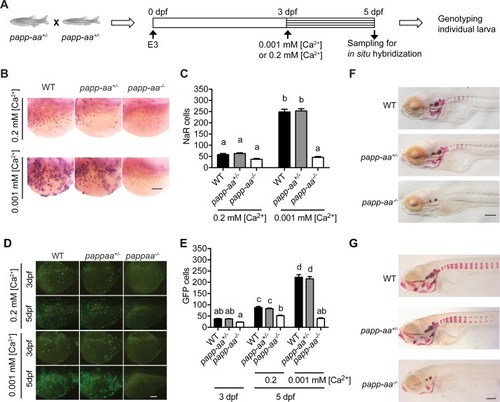
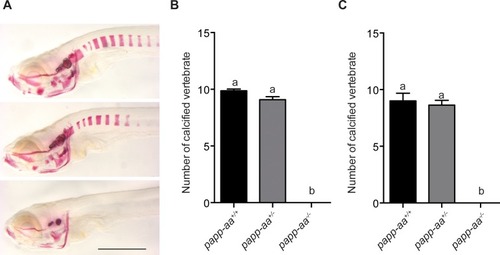
Genetic deletion of papp-aa impairs NaR cell reactivation and bone calcification.(A) Diagram of the experimental design. Progeny of papp-aa+/- fish intercrosses were raised in standard E3 embryo medium to three dpf. The progeny is a mixture of homo, hetero, and wild type embryos. They were transferred to the low [Ca2+] (0.001 mM) or normal [Ca2+] (0.2 mM) embryo medium at three dpf. Two days later, NaR cells in each fish were detected by igfbp5a mRNA expression and quantified. These fish were genotyped individually afterwards. (B–C) Progeny of papp-aa+/- intercrosses were treated as described in (A). Representative images are shown in (B) and quantified data in (C). Scale bar = 0.1 mm. n = 10 ~ 30 fish/group. In this and all subsequent figures, data shown are Mean ± SEM. Different letters indicate significant differences among groups by one-way ANOVA followed by Tukey’s multiple comparison test (p<0.05). (D–E) Progeny of papp-aa+/-;Tg(igfbp5a:GFP) fish intercrosses were raised in E3 medium to three dpf and transferred to the low [Ca2+] (0.001 mM) or normal [Ca2+] (0.2 mM) embryo medium. Two days later, the number of GFP-expressing NaR cells in each larva was quantified. The larvae were genotyped individually subsequently. Representative images are shown in (D) and quantified data in (E). Scale bar = 0.1 mm. n = 16 ~ 82 fish/group. (F–G) Fish of the indicated genotypes were raised in E3 embryo medium to 7 dpf and 12 dpf and stained with Alizarin Red. Scale bar = 0.2 mm. |
( |
( |
( |
( PHENOTYPE:
|
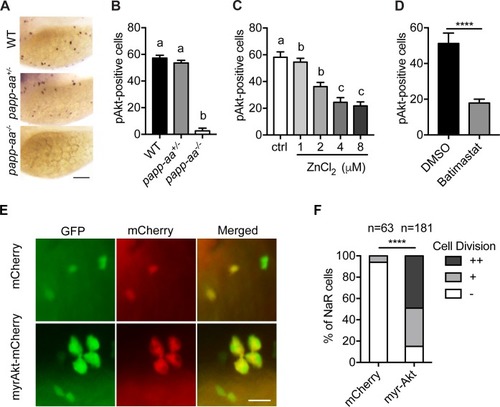
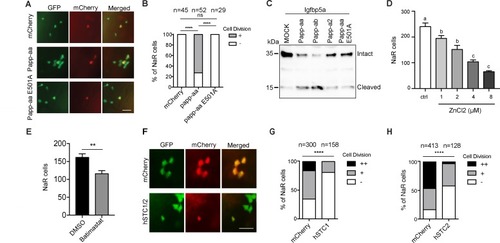
Papp-aa acts by regulating IGF-Akt-Tor signaling in NaR cells.(A–B) Zebrafish embryos of the indicated genotypes were transferred to the low [Ca2+] medium at three dpf. One day later, they were fixed and stained for phospho-Akt. Representative images are shown in (A) and quantitative results in (B). Scale bar = 0.1 mm. n = 25 ~ 58 fish/group. (C–D) Tg(igfbp5a:GFP) fish were transferred to the low [Ca2+] medium 0–8 µM ZnCl2 (C) or 200 µM batimastat (D) at three dpf. After one day treatment, they were analyzed by immunostaining for phospho-Akt. n = 18 ~ 24 fish/group. ****, p<0.0001, unpaired two-tailed t test. (E and F) Progeny of papp-aa+/-;Tg(igfbp5a:GFP) intercrosses were injected with BAC(igfbp5a:mCherry) or BAC(igfbp5a:myr-Akt-mCherry). They were raised and subjected to the low [Ca2+] stress test described in Figure 2A. NaR cells expressing mCherry or myr-Akt were scored as described in Figure 3. Representative images are shown in (E) and quantified data in (F). ++, two cell division, +, one cell division, -, no division during the experiment. Scale bar = 20 µm. ****, p<0.0001 by Chi-square test. Total number of cells is shown above the bar. |
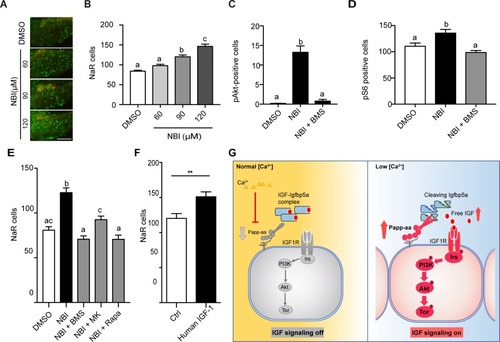
Disruption the IGF/Igfbp complex activates IGF-Akt-Tor signaling and promotes NaR cell reactivation.(A–B) Tg(igfbp5a:GFP) fish were transferred to normal [Ca2+] medium containing the indicated doses of NBI-31772 at three dpf. Two days later, NaR cells were quantified. Representative images are shown in (A) and quantified data in (B). Scale bar = 0.2 mm. n = 25 ~ 27 fish/group. (C) Wild-type fish were treated with 90 µM NBI-31772 with or without 0.3 µM BMS-754807 from 3 to 4 dpf. The number of cells positive for phosphorylated Akt staining were quantified and shown. n = 19 ~ 23 fish/group. (D) Larvae treated as described in (C) were stained for phosph-S6 and quantified. n = 14 ~ 15 fish/group. (E) Tg(igfbp5a:GFP) fish were treated with NBI-31772 (90 µM) together with BMS-754807 (0.3 µM), MK2206 (8 µM), or Rapamycin (5 µM) from 3 to 5 dpf. NaR cell number was quantified and shown. n = 10 ~ 24 fish/group. (F) Tg(igfbp5a:GFP) fish were treated with human IGF1 (150 ng/ml) in E3 embryo medium from 3 to 5 dpf. NaR cells were quantified and shown. n = 35 ~ 36 fish/group. **p<0.01, unpaired t-test. (G) Proposed model of Papp-aa function as a [Ca2+]-regulated molecular switch of IGF signaling in epithelial cells. Left panel: under normal [Ca2+] conditions, Papp-aa proteolysis activity is suppressed. Igfbp5a is intact and it inhibits IGF signaling by binding to IGFs and prevents their binding to the IGF1 receptor. The IGF- PI3 kinase-Akt-Tor signaling is inhibited in NaR cells. Right panel: under low [Ca2+] conditions, Papp-aa activity is increased. This increases Igfbp5a proteolytic cleavage and releases IGFs from the Igfbp5a/IGF complex. Bioavailable IGFs binds to IGF1 receptor and activates PI3 kinase-Akt-Tor signaling in NaR cells and promotes their reactivation and proliferate. |