FIGURE SUMMARY
Title

WNK1 Kinase Stimulates Angiogenesis to Promote Tumor Growth and Metastasis

Authors
Sie, Z.L., Li, R.Y., Sampurna, B.P., Hsu, P.J., Liu, S.C., Wang, H.D., Huang, C.L., Yuh, C.H.
Source
Full text @ Cancers

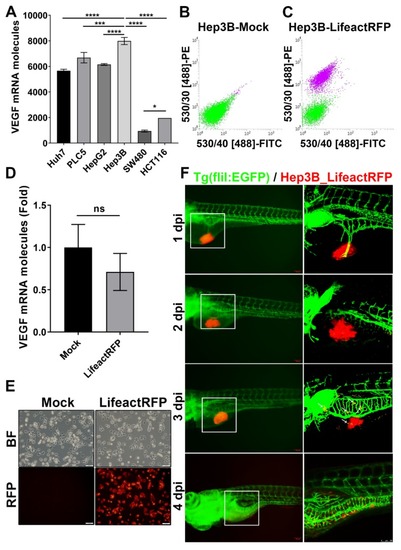
Establishment of stable RFP-expressing cancer cell line for tumor xenotransplantation study. (A) VEGF (VEGFA) mRNA expression in human hepatocellular carcinoma (Huh7, PLC5, HepG2, Hep3B) and colorectal cancer (SW480, HCT116) cell lines. The statistical significance was analyzed by one-way ANOVA. ns: non-significant, p > 0.05; *: 0.01 < p ≤ 0.05; ***: p ≤ 0.001; ****: p ≤ 0.0001; (B,C) FASC of un-transfected (B) and rLVUbi-Lifeact-TagRFP transfected Hep3B cells (C). The purple cell pools were sorted to create a stable Hep3B_Lifeact-RFP cell line. (D) mRNA expression of VEGFA in Hep3B and Hep3B_Lifeact-RFP stable line. ns, p > 0.05; unpaired Student’s t-test. (E) Representative bright field and fluorescent images of Hep3B and Hep3B_Lifeact-RFP stable line. Scale bar = 50 μm. (F) Representative images of Hep3B_Lifeact-RFP injected embryos from 1~4 day-post-injection (dpi) taken by fluorescent microscope (left) and confocal microscope (right). White arrow indicates metastatic cells at 3 dpi. Scale bar = 100 μm.

Effect of wnk1 knockdown on tumor-induced angiogenesis and tumor cell proliferation in zebrafish embryos. (A) Representative images of control embryos and embryos injected with Hep3B_Lifeact-RFP ± indicated morpholino. Images were at 2 dpi. Percentage of live embryos (number of live embryos/total embryos) for each experimental group was shown. Scale bar = 100 μm. (B) Percentage of embryos with (red zone) and without angiogenic response (green zone). Total number of embryos was 24. The statistical significance was analyzed by Chi-square test. ####: p ≤ 0.0001; ns: non-significant compared to the no morpholino control. ns: non-significant compared flk1 MO and wnk1a MO; *: 0.01 < p ≤ 0.05 compared wnk1a MO and wnk1b MO. (C,D) The average number of ectopic vessels (C) and length of ectopic vessels (D) in different morphants. The statistical significance was analyzed by unpaired Student’s t-test. **: 0.001 < p ≤ 0.01; ***: 0.0001 < p ≤ 0.001 compared to the no morpholino control. (E) Distribution of embryos with decreases (green zone), unchanged (blue) and increases in tumor-associated fluorescence in 1 dpi relative to 0 dpi. Changes of more than 5% on either direction were defined as decrease or increase. Total number of embryos was 24. The statistical significance was analyzed by Chi-square test. **: 0.001 < p ≤ 0.01; ns: non-significant compared to the no morpholino control. (F) Percentage changes of the tumor-associated fluorescent intensity in 1 dpi from 0 dpi. ns: non-significant, p > 0.05; *: 0.01 < p ≤ 0.05 compared to the no morpholino control. (G) Mortality rate of different morphants.

Effect of VEGF receptor inhibitor (PTK787), WNK inhibitor (WNK463) and OSR1/SPAK inhibitor (Closantel) on proliferation of xenotransplanted hepatoma cells. (A) Representative images of embryos before and after treated with DMSO (vehicle), PTK787, WNK463 or Closantel. Fish were immersed with drugs for 2 days beginning at 1 dpi (day postinjection) of hepatoma cells. (B,C) Distribution of embryos with decreases (green zone), unchanged (blue) and increases in tumor-associated fluorescence area (B) and intensity (C) after drugs. Total number of embryos was 24. The statistical significance was analyzed by Chi-square test. ns: non-significant, p > 0.05 comparison between different inhibitors. #: 0.01 < p ≤ 0.05; ####: p ≤ 0.0001 compared to the 0.1%DMSO control. **: 0.001 < p ≤ 0.01 compared PTK787 and WNK463. (D,E) Percentage changes of average fluorescent area (D) and average fluorescent intensity (E) at 3 dpi relative to 1 dpi. The statistical significance was analyzed by unpaired Student’s t-test. ns: non-significant, p > 0.05; *: 0.01 < p ≤ 0.05; ***: 0.0001 < p ≤ 0.001 compared to the 0.1% DMSO control.

Effect of WNK1 pathway inhibitors on transgene-activated colorectal cancer (CRC) in zebrafish. (AF) Tg (ifabp:RPIA; myl7:EGFP) adult fish were treated by oral gavage with DMSO (n = 15), WNK463 (n = 15) or Closantel (n = 15) and compared with wildtype fish treated with DMSO (n = 14). QPCR analysis was performed for zebrafish transgene ribose 5-phosphate isomerase A (RPIA), CRC promoting gene cyclin D1 (ccnd1), zebrafish WNK1 orthologue (wnk1a and wnk1b), VEGF receptor-2 (flk1/vegfr2), and angiogenesis/metastasis marker gene matrix metallopeptidase 9 (mmp9). The statistical significance was analyzed by unpaired Student’s t-test. ns: non-significant, p > 0.05; *: 0.01 < p ≤ 0.05; **: 0.001 < p ≤ 0.01; ***: 0.0001 < p ≤ 0.001; ****: p ≤ 0.0001. (G) Representative H&E-stained sections of intestinal tract of RPIA transgenic fish treated with or without inhibitors. Scale bar = 20 μm. (H) Distribution of histopathological findings from tissue sections as shown in panel G. The statistical significance was analyzed by Chi-square test. ****: p ≤ 0.0001.

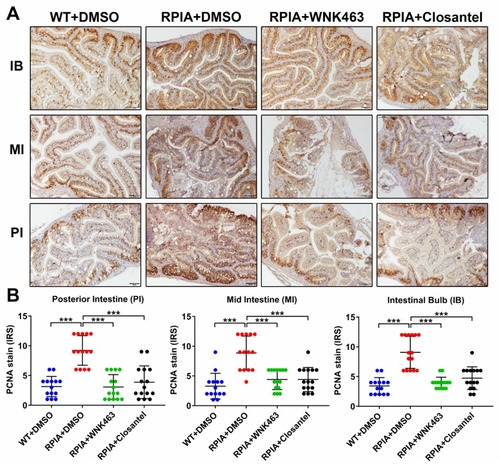
Effect of WNK1 pathway inhibitors on proliferating cell nuclear antigen (PCNA) expression in colorectal cancer. (A) Representative images and (B) immunoreactive score (IRS) of proliferating cell nuclear antigen (PCNA) staining on regions of intestine (IB: intestinal blub; MI: mid intestine; PI: posterior intestine) from WT and Tg (ifabp:RPIA; myl7:EGFP) fish treated with DMSO, WNK463 and Closantel. Scale bar = 50 μm. The statistical significance was analyzed by unpaired Student’s t-test. ***: p ≤ 0.001.

Xenotransplanted tumors produce WNK1 and induce endogenous WNK1 in zebrafish. (A) QPCR analysis of human WNK1 expression in xenotransplanted hepatoma at 0–3 dpi. (B,C) QPCR analysis of endogenous wnk1a and wnk1b in zebrafish 0–3 dpi hepatoma xenotransplantation. Statistical significance relative to 0 dpi. The statistical significance was analyzed by unpaired Student’s t-test. ns: non-significant, p > 0.05; *: 0.01 < p ≤ 0.05; **: 0.001 < p ≤ 0.01; ***: 0.0001 < p ≤ 0.001; ****: p ≤ 0.0001.

Endothelial cell-specific wnk1a expression promote tumorigenesis in HCC-transgenic fish. (AF) QPCR analysis of genes in WT, HBx, src(p53-) fish, and HBx, src(p53-) fish overexpressing wnk1a in endothelium. Two separate transgenic lines, TG1 and TG2, were studied. (GJ) Representative images of H&E-stained liver sections. Scale bar = 20 μm. (K–N) Representative images of immunohistochemical staining of liver sections for proliferating cell nuclear antigen (PCNA). Scale bar = 20 μm. The statistical significance was analyzed by unpaired Student’s t-test. **: 0.001 < p ≤ 0.01; ***: 0.0001 < p ≤ 0.001; ****: p ≤ 0.0001 compared to WT control. (O) Distribution of histopathological findings of H&E-stained liver sections as shown in panels (G–J). The statistical significance was analyzed by Chi-square test. ****: p ≤ 0.0001 compared to WT control, ####: p ≤0.0001 comparison between transgenic fish. (P) Average immunoreactive score (IRS) of proliferating cell nuclear antigen (PCNA) staining as shown in panels K-N. **: 0.001 < p ≤ 0.01; ***: 0.0001 < p ≤ 0.001; ****: p ≤ 0.0001 compared to WT control. ##: 0.001 < p ≤ 0.01 comparison between transgenic fish.

Effect of WNK1 pathway inhibitors on HCC in transgenic fish overexpressing endothelial cell-specific wnk1a. (AF) Representative images of H&E-stained liver sections from HBx, src(p53-) fish and two lines (TG1 and TG2) of HBx, src(p53-) transgenic fish overexpressing wnk1a in endothelia. Scale bar = 20 μm. (G–L) Representative images of PCNA staining of liver sections from fish as above. (M) Distribution of histopathological diagnosis of H&E-sections as shown in panels (A–F). The statistical significance was analyzed by Chi-square test. ****: p ≤0.0001. (N) Average immunoreactive score (IRS) of proliferating cell nuclear antigen (PCNA) staining as shown in panels (G–L). The statistical significance was analyzed by unpaired Student’s t-test. *: 0.01< p ≤0.05; **: 0.001< p ≤0.01.

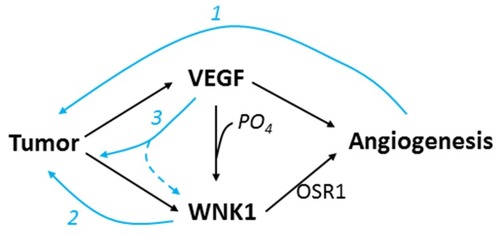
Model for WNK1 and VEGF interaction in angiogenesis and tumor growth. Tumor produces VEGF and WNK1, and both act to stimulate endothelial cells to form new blood vessels. WNK1 stimulates angiogenesis through downstream kinase OSR1. VEGF-stimulated angiogenesis is at least partly through PI3K/AKT-induced phosphorylation of WNK1. Three positive feedback loops participate in amplification of tumor growth: (1) angiogenesis providing nutrient for tumor to grow, (2) direct proliferative effect of WNK1 on tumor cells, and (3) expression of WNK1 from tumor or other tissues (dotted line) stimulated by VEGF.

Acknowledgments
This image is the copyrighted work of the attributed author or publisher, and ZFIN has permission only to display this image to its users. Additional permissions should be obtained from the applicable author or publisher of the image. Full text @ Cancers