FIGURE SUMMARY
Title

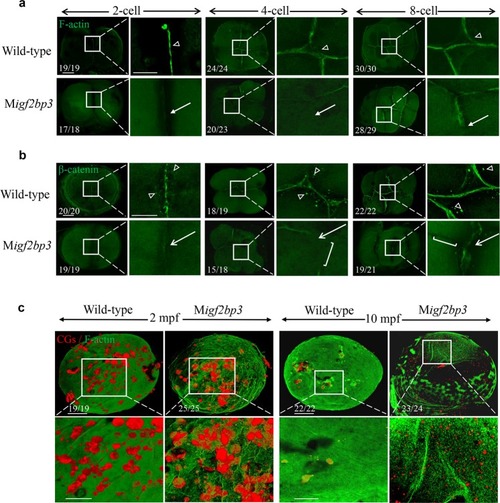
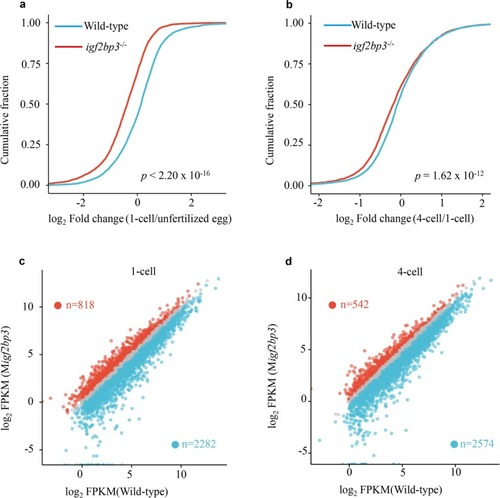
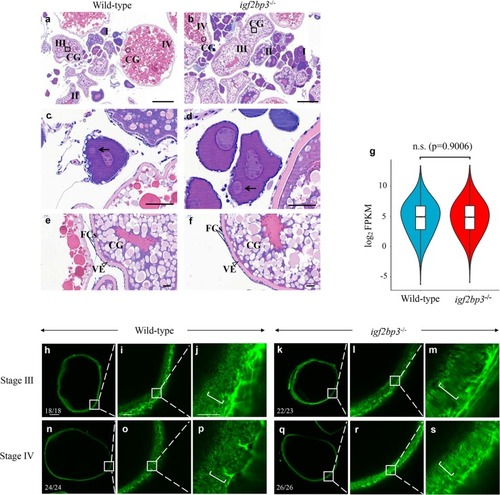
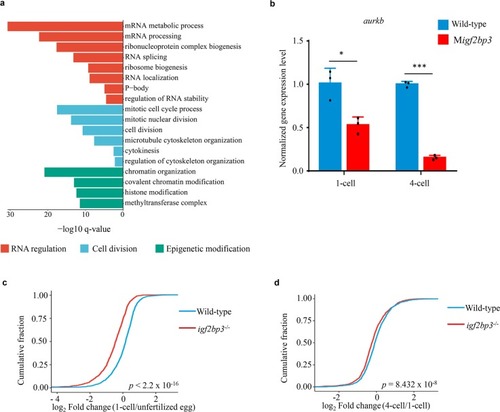
Igf2bp3 maintains maternal RNA stability and ensures early embryo development in zebrafish

Authors
Ren, F., Lin, Q., Gong, G., Du, X., Dan, H., Qin, W., Miao, R., Xiong, Y., Xiao, R., Li, X., Gui, J.F., Mei, J.
Source
Full text @ Commun Biol

Generation and characterization of <italic>igf2bp3</italic> mutant zebrafish.

a Design and mutation types of igf2bp3 based on CRISPR/Cas9 biotechnology. Exons were represented by purple boxes and the sgRNA target sequence was shown in red. Two types of mutants were generated. b Illustration of deduced protein structure of wild-type igf2bp3 and two mutated igf2bp3. c The developmental timecourse of wild type and Migf2bp3 embryos. Migf2bp3 embryos displayed an inapparent septum (white arrow) compared to that in wild type (black arrow) at 8-cell stage. The non-adhesive cells in the mutants were indicated by red arrows at 32- and 512-cell stage. d Statistical analysis of the phenotypes of Migf2bp3 and wild-type zebrafish embryos at 512-cell stage, as indicated in c. Wild type, N = 5, n = 708; Migf2bp3 (∆2nt), N = 6, n = 672; Migf2bp3 (∆41nt), N = 8, n = 749 (N = female individuals, n = embryos). Scale bars: 200 μm.

M<italic>igf2bp3</italic> embryos exhibit abnormal cytoskeleton organization.

a, b Expression and distribution of F-actin and β-catenin in wild type and Migf2bp3 embryos at 2-, 4-, and 8-cell stages. The F-actin and β-catenin were enriched in mature and apparent cleavage furrow (triangle). The inset showed a zoom-in of the boxed region at each stage. Zoomed-out scale bar = 100 μm; zoomed-in scale bar = 50 μm. a Migf2bp3 embryos at 4-cell stage did neither exhibit intact adhesion junction of F-actin cables nor form the mature furrow (white arrow). b Migf2bp3 embryos exhibited reduced expression of β-catenin (white arrows) and did not form intact cell adhesion junction with defective furrow (white bracket). c Double localization of F-actin (green fluorescence) and CG (red fluorescence). The inset showed a zoom-in of the boxed region at each stage. Zoomed-out scale bar = 100 μm; zoomed-in scale bar = 50 μm.

<italic>igf2bp3</italic> deficiency results in accelerated decay of maternal mRNA.

a, b Cumulative frequency of maternal mRNA log2 fold changes in wild type and Migf2bp3 from unfertilized eggs to 1-cell-stage embryos and 1- to 4-cell embryos, respectively. The p values were calculated using two-sided Wilcoxon and Mann–Whitney test. c, d Scatter plots showing the enrichment of dysregulated genes in wild type and Migf2bp3 embryos at 1- and 4-cell stages. The numbers of significantly downregulated genes (blue dots) or upregulated genes (red dots) were shown.

Oogenesis is largely unaffected in <italic>igf2bp3</italic> homozygous mutant (<italic>igf2bp3</italic><sup>−/−</sup>) zebrafish.

a, b H&E-stained ovary sections indicated cortical granule movement toward the cortex, structure of the vitelline envelope, and somatic follicle cells surrounding stage I–IV oocytes of wild type and igf2bp3−/− zebrafish. CGs cortical granules. Square box indicates CGs located centrally in young oocytes and round box indicates CGs in the cortex at late stage; Scale bars:100 μm. c, d The normal polarization of stage Ib oocytes as indicated by the presence of the Balbiani body (black arrowheads) in igf2bp3−/− zebrafish compared with the wild type. Scale bars: 50 μm. e, f H&E-stained stage III oocytes revealed cortical granule movement toward the cortex in wild type and igf2bp3−/− zebrafish. VE vitelline envelope (triangle box); FCs follicle cells (two straight lines). Scale bars: 20 μm. g Violin and box plots depicting the expression levels of maternal genes in unfertilized eggs. Lower/middle/upper position in box plots indicated 25/50/75% quantile, respectively. The violin width shows the gene density. Two-sided Wilcoxon and Mann–Whitney test was used. n.s. no significant. hs F-actin expression in wild type and igf2bp3 mutant oocytes. The inset showed a zoom-in of the boxed region. i, l, o, r In the subcortical regions of stage III–IV oocytes, the actin filaments became clearly distributed in both wild type and igf2bp3 mutant oocytes. j, m, p, s High magnification images of actin filaments in the oocyte cytoplasm. The actin columns were arranged from the inner to the outer across the cortical cytoplasm and thereby the column was arranged parallel to each other (brackets). Scale bars: 100 μm in h, k, n, q; 25 μm in i, l, o, r; 10 μm in j, m, p, s.

Igf2bp3 targets maternal mRNAs and regulates their stability in the early stage embryos.

a Gene Ontology analysis of the targets of Igf2bp3 in zebrafish embryo. b The expression levels of aurkb in the early development of zebrafish embryos. P values were calculated by two-sided Student’s t-test. (*p < 0.05, ***p < 0.001). c, d The fold changes in expression levels of Igf2bp3 targeting maternal mRNA in wild type and Migf2bp3 from unfertilized eggs to 1-cell-stage embryos and 1-cell to 4-cell embryos, respectively. P values were calculated by two-sided Wilcoxon and Mann–Whitney test.

Overexpression of <italic>igf2bp3</italic> leads to enhanced maternal mRNA stability and causes developmental delay in wild-type embryos.

a Time-matched bright field images of embryos indicated that igf2bp3-overexpressing embryos experienced a developmental delay at early stages. Scale bars: 200 μm. b The percentage of embryos with developmental delay at shield stage. The embryos exhibited delayed development in non-injected groups (N1 = 3/572, N2 = 7/515, N3 = 19/622), in GFP mRNA injected groups (N1 = 12/411, N2 = 4/460, N3 = 16/487), and in igf2bp3 mRNA injected groups (N1 = 378/481, N2 = 412/514, N3 = 439/503). c qRT-PCR analysis of maternal mRNA decay in wild type and igf2bp3-overexpressing embryos. mRNA abundance was normalized to values of wild type. Error bars represent mean±S.D., n = 3. P values were calculated by two-sided Student’s t-test (*p < 0.05, **p < 0.01, ***p < 0.001).

Unillustrated author statements

Acknowledgments
This image is the copyrighted work of the attributed author or publisher, and ZFIN has permission only to display this image to its users. Additional permissions should be obtained from the applicable author or publisher of the image. Full text @ Commun Biol