
- Title
-
Aberrant expression of miR-29b-3p influences heart development and cardiomyocyte proliferation by targeting NOTCH2
- Authors
- Yang, Q., Wu, F., Mi, Y., Wang, F., Cai, K., Yang, X., Zhang, R., Liu, L., Zhang, Y., Wang, Y., Wang, X., Xu, M., Gui, Y., Li, Q.
- Source
- Full text @ Cell Prolif.
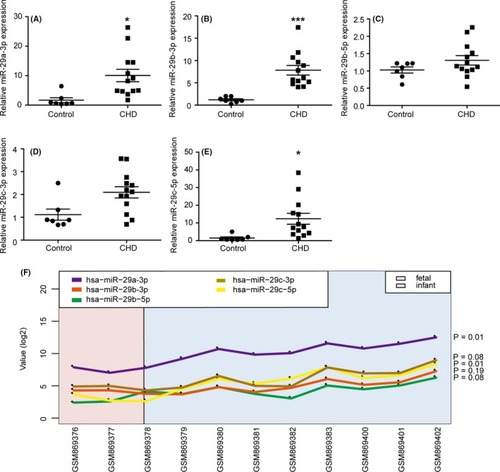
Relative expression of miR‐29b‐3p was higher in the right ventricular outflow tract (RVOT) of congenital heart disease (CHD) patients. The expression of miR‐29a‐3p (A), miR‐29b‐3p (B), miR‐29b‐5p (C) miR‐29c‐3p (D), miR‐29c‐5p (E) in the RVOT of CHD patients (n = 13) and controls (n = 7) was determined via miRNA stem loop RT‐PCR. MiRNAs were normalized to U6 expression. The expressions of miR‐29a‐3p, miR‐29b‐3p and miR‐29c‐5p were up‐regulated in the RVOT of the CHD patients than the controls. F, The influence of age to the expression of miR‐29 family. Only miR‐29b‐3p expression was not altered as age increased among the 3 up‐regulated miR‐29 family members. The data are presented as the mean ± SEM. Statistical significance is shown as * |
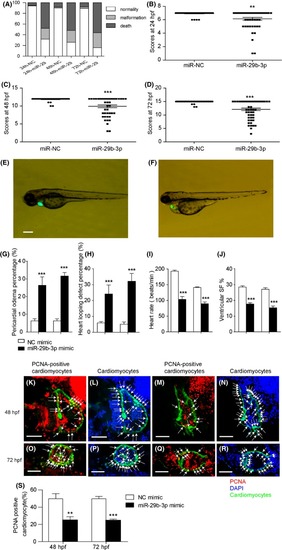
MiR‐29b‐3p injection disturbed the development of zebrafish heart. A, MiR‐29b‐3p injection led to a higher mortality and malformation rate in zebrafish embryos from 24 to 72 hpf (n > 100). B‐D, The general morphology score system was used to evaluate the development of zebrafish embryos. MiR‐29b‐3p injection induced a developmental delay in zebrafish embryos at 24, 48 and 72 hpf (n > 50). E, Normal heart morphology of 72 hpf zebrafish embryos injected with miR‐NC mimic. F, Abnormal heart morphology of 72 hpf zebrafish embryos injected with miR‐29b‐3p mimic, including pericardial oedema and looping defects. Cardiac visualization under bright‐field microscopy, with the photographs showing heart morphology (bar = 100 µm). G and H, MiR‐29b‐3p injection caused a higher degree of pericardial oedema and looping defects in zebrafish embryos (n > 50). I and J, MiR‐29b‐3p injection induced a decrease in heart rate and ventricular shortening fraction (n > 50). K‐N, PCNA in the hearts of zebrafish embryos injected with NC mimic (K, L) or miR‐29b‐3p mimic (M, N) at 48 hpf. O‐R, PCNA in the hearts of zebrafish embryos injected with NC mimic (O, P) or miR‐29b‐3p mimic (Q, R) at 72 hpf. Arrows indicated PCNA‐positive cardiomyocytes (K, M, O, Q) and the nuclei of cardiomyocytes (L, N, P, R). The proliferation index was calculated by dividing the number of PCNA‐positive cardiomyocytes by the total number of cardiomyocytes at the largest anatomical level of the ventricle. Cmlc2‐positive (green) staining indicated cardiomyocytes, nuclei were labelled with DAPI (blue), and PCNA‐positive (red) staining indicated proliferative cells (bar = 50 µm). S, Quantitative assessment of the proliferation index of PCNA‐positive cardiomyocytes (n = 5‐7). The data are presented as the mean ± SEM. Statistical significance is shown as * |

MiR‐29b‐3p decreased HL1 cell proliferation. A, Cell viability assay was assessed via CCK‐8 assays. Cell viability was lower in the miR‐29b‐3p mimic group and higher in its inhibitor group. B and C, EdU incorporation assay of cardiomyocytes. Microscopy images illustrated the EdU and Hoechst staining of cardiomyocytes after transfection with miR‐29b‐3p mimic or inhibitor (bar = 50 μm). The percentage of proliferating cardiomyocytes was calculated (n > 1000). EdU incorporation was decreased in the miR‐29b‐3p mimic group and enhanced in its inhibitor group. D, WB analysis of PHH3 and PCNA. E, Relative quantification of PHH3 and PCNA protein. The expressions of PHH3 and PCNA protein were down‐regulated in the miR‐29b‐3p mimic group and up‐regulated in its inhibitor group. The data are presented as the mean ± SEM. Statistical significance is shown as * |

The expression of NOTCH2 was lower in the right ventricular outflow tract of congenital heart disease (CHD) patients. A‐F, Relative mRNA expressions of NOTCH2, COL6A2, FOXP1, NRAS, SNIP1 and VEGFA were analysed using real time RT‐PCR and normalized to β‐actin. NOTCH2 exhibited lower mRNA expression in the CHD patients (n = 13) than in the controls (n = 7). G, Immunohistochemical analysis of NOTCH2 in the RVOT of the controls (N1, N2) and CHD patients (CHD‐1, CHD‐2). The heart tissues in the CHD patients showed weak cytoplasmic staining for NOTCH2 (bar = 100 µm). H, NOTCH2 protein was assessed in the CHD patients (n = 9) and the controls (n = 4) with WB. NOTCH2 protein expression was lower in the CHD patients than in the controls. The data are presented as the mean ± SEM. Statistical significance is shown as * |
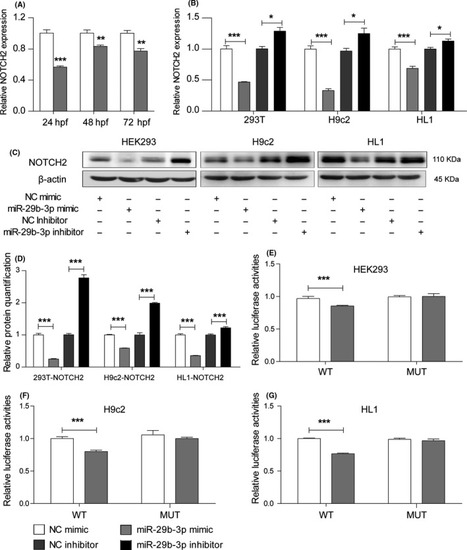
MiR‐29b‐3p regulated NOTCH2 by directly targeting its 3' UTR. A, The mRNA expression of NOTCH2 was decreased in zebrafish embryos injected with miR‐29b‐3p mimic vs NC mimic from 24 to 72 hpf. B, qRT‐PCR results showed that NOTCH2 mRNA expression was decreased in the miR‐29b‐3p mimic group and increased in the inhibitor group. C, WB results showed that NOTCH2 protein expression was lower in cells transfected with miR‐29b‐3p mimic and higher in cells transfected with miR‐29b‐3p inhibitor. D, Relative quantification of NOTCH2 protein. E, HEK‐293 cells was co‐transfected with psiCHECK‐2‐NOTCH2‐3'UTR‐WT‐Human (100 ng) or psiCHECK‐2‐NOTCH2‐3'UTR‐MUT‐Human (100 ng) and miR‐29b‐3p mimic (20 pmol) or NC mimic (20 pmol). F, H9c2 cells were co‐transfected with psiCHECK‐2‐NOTCH2‐3'UTR‐WT‐Rat (100 ng) or psiCHECK‐2‐NOTCH2‐3'UTR‐MUT‐Rat (100 ng) and miR‐29b‐3p mimic (20 pmol) or NC mimic (20 pmol). G, HL1 cells were co‐transfected with psiCHECK‐2‐NOTCH2‐3'UTR‐WT‐Mouse (100 ng) or psiCHECK‐2‐NOTCH2‐3'UTR‐MUT‐Mouse (100 ng) and miR‐29b‐3p mimic (20 pmol) or NC (20 pmol) mimic. MiR‐29b‐3p decreased the relative luciferase activity in the WT group but had no effect in the MUT group. The data are presented as the mean ± SEM. Statistical significance is shown as * |
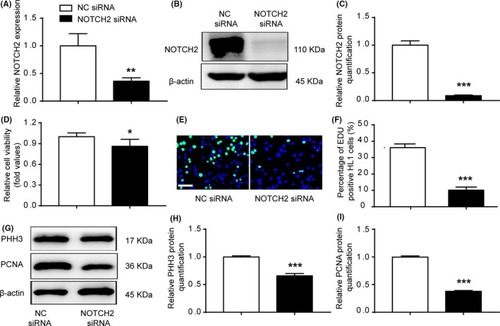
NOTCH2 siRNA inhibited cardiomyocyte proliferation. A‐C, qRT‐PCR and WB were performed in HL1 cells transfected with NOTCH2 siRNA. NOTCH2 siRNA decreased the endogenous NOTCH2 expression. D, Cell viability was examined via CCK‐8 assays. Cells transfected with NOTCH2 siRNA exhibited decreased cell viability compared with the control cells. E and F, EdU incorporation assay of cardiomyocytes. NOTCH2 siRNA decreased EdU incorporation (n > 1000, bar = 50 μm). G, WB analysis of PHH3 and PCNA. H and I, Relative quantification of PHH3 and PCNA protein. The expression of PHH3 and PCNA protein was down‐regulated in the NOTCH2 siRNA group. The data are presented as the mean ± SEM. Statistical significance is shown as * |

NOTCH2 siRNA partially weakened the pro‐proliferative effect of miR‐29b‐3p inhibitor. A, Cell viability was examined via CCK‐8 assays. Increased cell viability was observed in cells transfected with miR‐29b‐3p inhibitor, and co‐transfection with NOTCH2‐siRNA decreased cell viability. B and C, EdU incorporation assay of cardiomyocytes. Increased EdU incorporation was observed in the miR‐29b‐3p inhibitor group, and co‐transfection with NOTCH2‐siRNA decreased this change (n > 1000, bar = 50 μm). D, WB analysis of NOTCH2, PHH3 and PCNA. E, Relative quantification of NOTCH2, PHH3 and PCNA protein. The expression of NOTCH2, PHH3 and PCNA protein was higher in the miR‐29b‐3p inhibitor group and was decreased by co‐transfection with NOTCH2‐siRNA. The data are presented as the mean ± SEM. Statistical significance is shown as * |

NOTCH2 promoted cardiomyocyte proliferation. A‐C, qRT‐PCR and WB were performed in HL1 cells transfected with pCHD‐NICD2‐puro plasmid. The plasmid increased the endogenous NOTCH2 expression. D, Cell viability was examined via CCK‐8 assays. Cells transfected with pCHD‐NICD2‐puro plasmid promoted cell viability compared with the control group. E and F, EdU incorporation assay of cardiomyocytes. Overexpression of NOTCH2 increased EdU incorporation (n > 1000, bar = 50 μm). G, WB analysis of PHH3 and PCNA. H and I, Relative quantification of PHH3 and PCNA protein. The expression of PHH3 and PCNA protein was up‐regulated in the NOTCH2 group. The data are presented as the mean ± SEM. Statistical significance is shown as * |

NOTCH2 attenuated the inhibitory effect of miR‐29b‐3p mimic on cell proliferation. A, Cell viability was examined via CCK‐8 assays. Decreased cell viability was observed in cells transfected with miR‐29b‐3p mimic, and co‐transfection with NOTCH2 increased cell viability. B and C, EdU incorporation assay of cardiomyocytes. Decreased EdU incorporation was observed in the miR‐29b‐3p mimic group, and co‐transfection with NOTCH2 decreased this change (n > 1000, bar = 50 μm). D, WB analysis of NOTCH2, PHH3 and PCNA. E, Relative quantification of NOTCH2, PHH3 and PCNA protein. The expression of NOTCH2, PHH3 and PCNA protein was lower in the miR‐29b‐3p mimic group and was increased by co‐transfection with NOTCH2. The data are presented as the mean ± SEM. Statistical significance is shown as * |