FIGURE SUMMARY
Title

Autophagy Activation in Zebrafish Heart Regeneration

Authors
Chávez, M.N., Morales, R.A., López-Crisosto, C., Roa, J.C., Allende, M.L., Lavandero, S.
Source
Full text @ Sci. Rep.

Autophagic vesicle formation in the heart ventricle is increased during zebrafish cardiac regeneration. Electron microscopy shows a high degree of tissue remodeling of the cardiac muscle, as well as the formation of several autophagosome and phagolysosome vesicles upon apex amputation (yellow arrow heads and higher-magnification images below). An increase in the number of autophagic vesicles was above all evident in regions closer to the injured area (proximal), while also found significantly more abundant at 3 dpa distal to the amputation plane. Insets represent higher magnifications of the observed autophagic vesicles at each experimental time point. Scale bars represent 2 μm. *p ≤ 0.05. N ≥ 3.

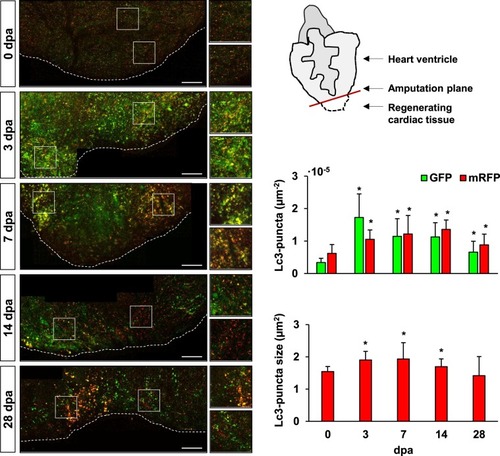
Enhanced accumulation of autophagosomes and phagolysosomes is observed in the injured cardiac tissue upon amputation. The transgenic line Tg(b-actin2:mRFP-GFP-Lc3) allows the observation of autophagosome formation and processing in the regenerating zebrafish heart ventricle at different time points after apex amputation. Autophagosomes are depicted both as GFP- and RFP-puncta, while the lower pH-sensitivity of RFP additionally allows the visualization of phagolysosomes. Images were taken immediately after heart excision, and upon overnight incubation of the zebrafish in 2 mM CQ, which acts as a lysosomal inhibitor. Quantitative analysis revealed a significant increase in the number of both vesicles, as well as in the average autophagosome/phagolysosome size (red puncta) in the regenerating tissue, which gradually decreased over time. A schematic view of the ventricle orientation and the region of interest considered for image acquisition is shown, while higher magnifications exemplifying the accumulation of bigger autophagic vesicles are presented next to the mosaic images. Scale bars represent 200 μm. *p ≤ 0.05. N ≥ 3.

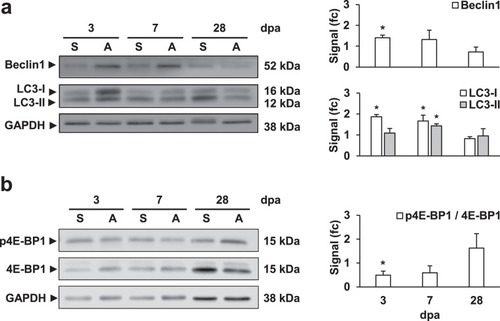
Western blot analysis suggests the activation of autophagy at the early stages of cardiac regeneration. The stimulation of autophagy at 3 dpa and the increased formation of autophagosomes between days 3–7 post-amputation, in comparison to sham-operated animals, is observed in the increased abundance of Beclin1, Lc3-I and Lc3-II, respectively (a). Moreover, a significant decrease on the phosphorylation ratio of the mTOR-target 4E-BP1 suggests the inhibition of mTOR at the early regeneration stages (b). Signal levels were normalized first to GAPDH-loading controls and then compared to the respective sham-control. Results were obtained from at least three biological replicates and averaged for the final statistical analysis. Representative blot-images of are shown, while full-length blots are presented in the Supplementary Information (Supp. Fig. 1). fc: fold change. *p ≤ 0.05. N ≥ 3.

Rapamycin treatment affects the inflammatory phase of the cardiac regeneration process. Zebrafish were treated with rapamycin via intraperitoneal injection two days before the amputation procedure and every second day afterwards (a). The effect of rapamycin treatment was verified by the accumulation of Beclin-1 and Lc3 after 9 doses. Results were obtained from at least three biological replicates. Signal levels were normalized first to GAPDH-loading controls and then compared to the control treatment. (fc: fold change). Full-length blots representative of the results can be found in the Supplementary Information (Supp. Fig. 3). Upon amputation, rapamycin-treated zebrafish showed an increased number of apoptotic TUNEL+-nuclei in the affected ventricle area (c), as well as an increased presence of mpx+-neutrophils (d). Also, mpeg1+-macrophage recruitment at 5 dpa was affected by the treatment, as shown by their decreased presence of the affected area (e, % area covered by macrophages). Altogether, the results suggest an alteration in the inflammatory mechanisms triggered upon apex amputation. The results obtained from the quantification of all fluorescent signals were normalized to the area of the regenerating tissue considered, which was delimited by the amputation plane on the ventricle (white discontinuous line). Scale bars represent 50 μm. TUNEL+: Control N ≥ 14, Rapamycin N ≥ 13; mpx+: Control N ≥ 14, Rapamycin N ≥ 16; mpeg1+: Control N ≥ 8, Rapamycin N ≥ 9. *p ≤ 0.05, **p ≤ 0.001.

Rapamycin treatment affects zebrafish cardiac regeneration. Rapamycin-treatment affected angiogenesis upon amputation, causing a negative effect in the re-vascularization rate of the regenerating zebrafish ventricle at 7 dpa (a, fli1a+-covered area expressed in relation to the regenerating ventricle area); yet, the same treatment had a specific positive effect over cardiomyocyte proliferation at 14 dpa (normalized by the area considered for the quantification) (b). Still, sustained rapamycin administration impaired zebrafish cardiac regeneration, as shown by the AFOG-staining of amputated treated and control hearts at 28 dpa, which allows to visualize the remains of fibrin (red)- and collagen (blue)- provisional extracellular matrices, as well as the uninjured/restored cardiac muscle (yellow/brown) (c). The quantification of the non-regenerated area (normalized to the total ventricle area) showed that treatment with rapamycin for up to 14 dpa caused a significant impairment of the regenerative outcome of the zebrafish heart. Scale bar represents 100 µm in (a,b) and 50 µm in (c). fli1a+: Control N ≥ 8, Rapamycin N ≥ 7; PCNA+-myl7+: Control N ≥ 8, Rapamycin N ≥ 9, AFOG-staining: Control N ≥ 10, Rapamycin N ≥ 12. *p ≤ 0.05, **p ≤ 0.001.

Acknowledgments
This image is the copyrighted work of the attributed author or publisher, and ZFIN has permission only to display this image to its users. Additional permissions should be obtained from the applicable author or publisher of the image. Full text @ Sci. Rep.