
- Title
-
Experience-dependent development of visual sensitivity in larval zebrafish
- Authors
- Xie, J., Jusuf, P.R., Bui, B.V., Goodbourn, P.T.
- Source
- Full text @ Sci. Rep.

Schematic of the optomotor assay. ( |
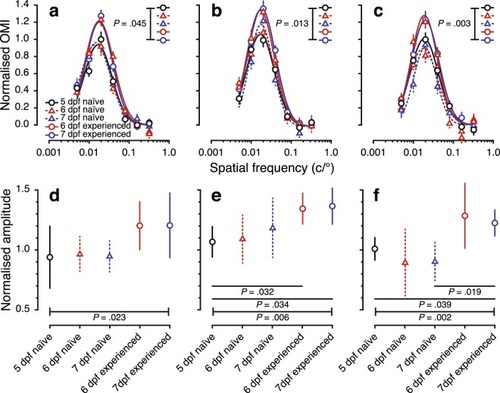
Spatial-frequency tuning from the optomotor response of visually naïve and experienced larval zebrafish from 5 to 7 dpf. The top row shows spatial-frequency tuning functions (mean ± SEM) at stimulus speeds of ( |
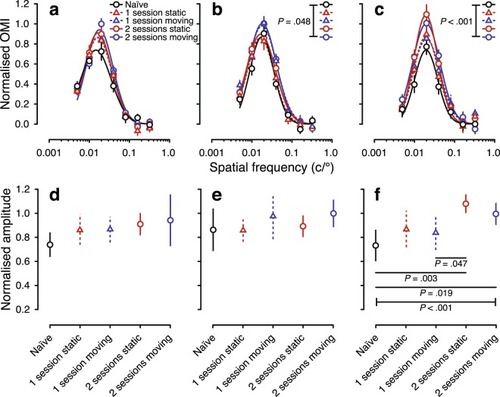
Spatial-frequency tuning from the optomotor response of visually naïve and experienced larval zebrafish at 7 dpf. The top row shows spatial-frequency tuning functions (mean ± SEM) at stimulus speeds of ( |

PSD-95 in the retinal IPL of visually naïve and experienced larvae from 5 to 7 dpf. ( |