
- Title
-
TGF-β Signaling Promotes Tissue Formation during Cardiac Valve Regeneration in Adult Zebrafish
- Authors
- Bensimon-Brito, A., Ramkumar, S., Boezio, G.L.M., Guenther, S., Kuenne, C., Helker, C.S.M., Sánchez-Iranzo, H., Iloska, D., Piesker, J., Pullamsetti, S., Mercader, N., Beis, D., Stainier, D.Y.R.
- Source
- Full text @ Dev. Cell

Decellularization of the Zebrafish Atrio-Ventricular Valve Triggers a Regenerative Program Leading to a New Valve (A) Schematics of the zebrafish AV valve leaflet depicting the lining VECs and the ECM-embedded VICs. (B and B′) Cryosection of Tg(nfatc1:NTR-mCherry) heart showing NTR-mCherry expression in VICs in the AV and bulbo-ventricular (BV) valves (arrows point to nfatc1− VECs). Boxed area shown in (B′). (C and C′) A minority of VECs are NTR-mCherry+ (arrowheads), while most kdrl:GFP+ cells are NTR-mCherry− (arrows; n = 4). Boxed area shown in (C′). (D) Ablation protocol using the NTR-Mtz system (D). (E and F) TUNEL detection (E and E′) and quantification (F) in ablated hearts show apoptotic cells only in the valve leaflets. Plot values represent means ± SEM. (G and H) TEM images of uninjured (G; n = 3) and 48 hpab (H; n = 3) valve sections showing the morphology of the lining VECs (green) and VICs (red) before and after ablation. (I–L) Representative images of the AV valve regeneration process illustrating the uninjured valve (I; same section as in Figures 1B and 1B′; n = 8), tissue decellularization (J; n = 16), formation of new valve leaflets (K; arrows point to new valve cells; n = 8), and completion of regeneration (L; n = 10) with ECM labeled by Elastin1 antibody. Yellow and pink dashed lines delineate the old and new valve leaflets, respectively. A, atrium; V, ventricle; P, proximal; D, distal. Scale bars: (A) 50 μm; (B and E) 200 μm; (B′), (C), (E′), and (I–L) 100 μm, (C′) 20 μm; and (G and H) 10 μm. See also Figure S1; Videos S1, S2, S3, and S4. |

New Valve Cells Differentiate from Endothelial Cells and Kidney Marrow-Derived Cells (A and A′) EdU detection and kdrl:GFP expression in 48 hpab valves (arrowheads point to double-positive cells; n = 4). (B) Uninjured valve showing absence of fli1a:H2B-GFP expression in VICs (n = 4). (C and D) Characterization (C and C′; n = 4) and quantification of the percentage (D) of EdU+ cells positive for fli1a:H2B-GFP expression. Boxed areas shown in (A′) and (C′). (E) Co-localization of kdrl reporter with Fli1 antibody (arrowheads; n = 4). Boxed areas shown in E′ and (E″). (F–G″′) Cre/lox lineage tracing experiments show a few endothelial-derived nfatc1+ cells (arrowheads) in uninjured valves (F and F′; n = 6) and contribution of endothelial cells to nfatc1+ VICs (arrowheads) at 14 dpab (G–G″′; n = 9). Boxed areas shown in (F′) and (G′–G″′). Yellow and pink dashed lines delineate the old and new valve leaflets, respectively. (H–I″) WKM-derived cells in uninjured valves (H and H′; n = 3) and positive for EdU (I–I″) at 48 hpab. (J–K″) Quantification (J) and localization (K–K″) of WKM-derived cells negative for the immune cell marker L-Plastin. Boxed areas shown in (H′), (I′), (I″), (K′), and (K″). (L–L″′) Contribution of circulating WKM-derived cells to new nfatc1+ cells (arrowheads) at 14 dpab (n = 4). Boxed areas shown in (L′–L″′). A, atrium; V, ventricle. Scale bars: (A), (B), (C), (E), (F), (G), (H), (I), (K), and (L) 100 μm; (A′), (C′), (E′ and E″), (F′), (G′–G″′), (H′), (I′–I″), (K′ and K″), and (L′–L″′) 20 μm. |

New Valve Cells Differentiate from Endothelial Cells and Kidney Marrow-Derived Cells (A and A′) EdU detection and kdrl:GFP expression in 48 hpab valves (arrowheads point to double-positive cells; n = 4). (B) Uninjured valve showing absence of fli1a:H2B-GFP expression in VICs (n = 4). (C and D) Characterization (C and C′; n = 4) and quantification of the percentage (D) of EdU+ cells positive for fli1a:H2B-GFP expression. Boxed areas shown in (A′) and (C′). (E) Co-localization of kdrl reporter with Fli1 antibody (arrowheads; n = 4). Boxed areas shown in E′ and (E″). (F–G″′) Cre/lox lineage tracing experiments show a few endothelial-derived nfatc1+ cells (arrowheads) in uninjured valves (F and F′; n = 6) and contribution of endothelial cells to nfatc1+ VICs (arrowheads) at 14 dpab (G–G″′; n = 9). Boxed areas shown in (F′) and (G′–G″′). Yellow and pink dashed lines delineate the old and new valve leaflets, respectively. (H–I″) WKM-derived cells in uninjured valves (H and H′; n = 3) and positive for EdU (I–I″) at 48 hpab. (J–K″) Quantification (J) and localization (K–K″) of WKM-derived cells negative for the immune cell marker L-Plastin. Boxed areas shown in (H′), (I′), (I″), (K′), and (K″). (L–L″′) Contribution of circulating WKM-derived cells to new nfatc1+ cells (arrowheads) at 14 dpab (n = 4). Boxed areas shown in (L′–L″′). A, atrium; V, ventricle. Scale bars: (A), (B), (C), (E), (F), (G), (H), (I), (K), and (L) 100 μm; (A′), (C′), (E′ and E″), (F′), (G′–G″′), (H′), (I′–I″), (K′ and K″), and (L′–L″′) 20 μm. |

Manipulation of TGF-β Signaling Alters Cell Cycle Re-entry and Differentiation into nfatc1+ Cells during Cardiac Valve Regeneration (A) Schematics of the impact of the inhibition tools on TGF-β signaling (gray color indicates absence of phosphorylation of, and by, the receptor). (B and C) Schematics of the drug (B) and heat-shock (C) treatments. (D–G) EdU detection at 48 hpab in control samples (D), after SB431542 treatment (E), after overexpression of DNalk5a (F), and in tgfß1b mutants (G). (H and I) Schematics (H) and EdU detection (I) after tgfß1b overexpression. Pink dashed lines delineate the old valve leaflets. (J) Quantification of EdU+ cells after TGF-β signaling manipulation. (K–L′) Characterization of new valve cell differentiation at 14 dpab in control (K) and after tgfß1b overexpression (L and L′). Arrowhead points to new nfatc1+ cells. Boxed area shown in (L′). Yellow and pink dashed lines delineate the old and new valve leaflets, respectively. (M) Quantification of new nfatc1+ valve cells at 14 dpab. Plot values represent means ± SEM. (∗p < 0.05 by Mann Whitney test) A, atrium; V, ventricle; Exptl, experimental. Scale bars: (D–G), (I), (K), (L) 100 μm; (L′) 20 μm. See also Figures S3 and S4. |
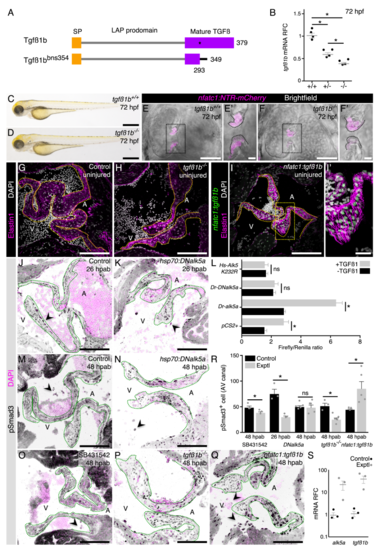
Figure S4. Validation of the TGFß signaling manipulation tools, related to Figure 4.(A) Tgfß1b wild-type and mutant proteins. (B) tgfß1bmRNA relative fold change (RFC)in 72 hpf wild-type, heterozygous and homozygous mutant larvae. (C-F’) No gross morphological defects are detected in mutant larvae (C, D) and their heart also appears unaffected (E-F’). (G-I’) Uninjured adult valves of control (G; n=8), tgfß1b mutant (H; n=4), and nfatc1:tgfß1b overexpression line (I, I’; n= 4) appear morphologically similar. (J-K) pSmad3 detection to determine the levels of TGFß signaling activation at 26 hpab in control (J) and DNalk5a (K)fish. (L) In vitro luciferase assay of human HEK cells after transfection of wild-type or dominant negative zebrafish alk5a or dominant negative human ALK5in the presence/absence of TGFß1. (M-Q) pSmad3 detection at 48 hpab in control (M), after overexpression of DNalk5a (N), after SB431542 treatment (O), in tgfß1bmutants (P), and after overexpression oftgfß1b (Q). (R) Quantification of pSmad3+cells in the AV canal. (S) qPCR analysis of mRNA levels RFC of alk5a and tgfß1bin the overexpression lines. Plot values represent means ± SEM.(ns –not significant, *P<0.05 by Mann Whitney test). Dashed lines delineate the AV valve leaflets. SP –signaling peptide, LAP –latency associated peptide, A –atrium, V –ventricle. Exptl -Experimental. Scale bars: (C), (D) 500 μm, (E), (F) 50 μm, (E’), (F’) 10 μm, (G), (H), (I), (J), (K), (M-Q) 100 μm, (I’) 20 μm. EXPRESSION / LABELING:
PHENOTYPE:
|
Reprinted from Developmental Cell, 52(1), Bensimon-Brito, A., Ramkumar, S., Boezio, G.L.M., Guenther, S., Kuenne, C., Helker, C.S.M., Sánchez-Iranzo, H., Iloska, D., Piesker, J., Pullamsetti, S., Mercader, N., Beis, D., Stainier, D.Y.R., TGF-β Signaling Promotes Tissue Formation during Cardiac Valve Regeneration in Adult Zebrafish, 9-20.e7, Copyright (2019) with permission from Elsevier. Full text @ Dev. Cell