
- Title
-
Genetic Reprogramming of Positional Memory in a Regenerating Appendage
- Authors
- Wang, Y.T., Tseng, T.L., Kuo, Y.C., Yu, J.K., Su, Y.H., Poss, K.D., Chen, C.H.
- Source
- Full text @ Curr. Biol.
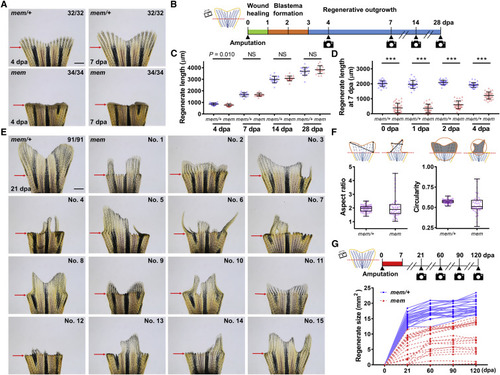
mem, a Temperature-Sensitive Mutant Defective in Fin Regeneration (A) Whole-mount images of adult mem/+ and mem fin regenerates at 4 and 7 dpa (days post-amputation). Red arrows indicate amputation plane. Scale bar, 1 mm. (B) Schematic timeline of three distinct phases during zebrafish fin regeneration. Green bar indicates the wound healing phase. Orange bar indicates the blastema formation phase. Blue bar indicates the regenerative outgrowth phase. (C) Measurement of mem fin regenerate length in fish maintained at 26°C at 4, 7, 14, and 28 dpa (n = 20 mem/+, 17 mem; mean ± SD; Student’s t test; NS, non-significant). (D) Measurement of mem fin regenerate length at 7 dpa. The 2nd lateral bony ray from the dorsal side was measured to represent tailfin length. After amputation, animals were shifted from the permissive temperature (26°C) to the restrictive temperature (33°C) at 0, 1, 2, or 4 dpa (n = 31 mem/+, 35 mem; 32 mem/+, 30 mem; 31 mem/+, 33 mem; and 31 mem/+, 32 mem; mean ± SD; Student’s t test; ∗∗∗p < 0.001). (E) Whole-mount images of mem fin regenerates at 21 dpa (n = 91 mem/+, 94 mem; mem regenerates were highly variable in shape and size). Animals were kept at the restrictive temperature from day 0 to 7 dpa. Red arrows indicate amputation plane. Scale bar, 1 mm. (F) Shape factors of mem regenerates at 21 dpa are shown in box and whisker plots. Left: aspect ratio was determined as the ratio of the major axis of the regenerate to the minor axis. Right: circularity index was determined as the ratio of the regenerate size to the area circled by a perimeter (n = 48 mem/+, 42 mem; median values are shown; boxes indicate the 25% and 75% percentiles; bars, the minimum and maximum values). (G) Top: schematic timeline of temperature shifts after fin amputation. Red bar indicates the period at 33°C. Bottom: measurement of mem fin regenerate sizes at 21, 60, 90, and 120 dpa are shown. After 7 days at the restrictive temperature, animals were maintained at the permissive temperature for a 4-month period (n = 24 mem/+, 22 mem). See also Figure S1. PHENOTYPE:
|
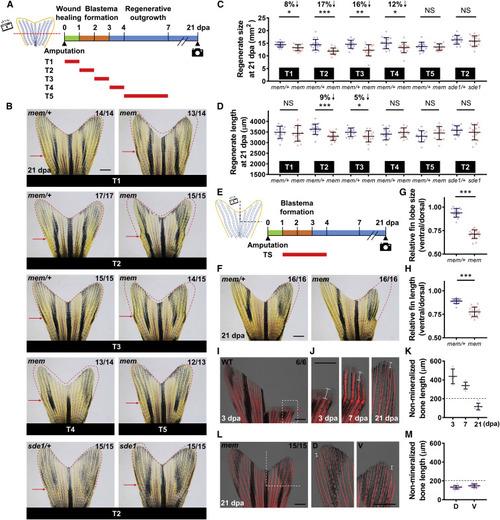
mem Inactivation within a 48-h Time Window Alters Fin Regenerate Size (A) Schematic timeline of temperature shifts after fin amputation. Green bar indicates the wound healing phase. Orange bar indicates the blastema formation phase. Blue bar indicates the regenerative outgrowth phase. Red bars indicate the period of the heat treatment at the restrictive temperature (33°C). (B) Whole-mount images of mem fin regenerates at 21 dpa with different heat treatments. Red dashed lines depict mem/+ regenerate size with the same treatment scheme to facilitate visual comparison between mem and mem/+. Red arrows indicate amputation plane. Scale bar, 1 mm. (C and D) Measurement of mem fin regenerate size (C) and length (D) at 21 dpa with different heat treatments. The 2nd lateral bony ray from the dorsal side was measured to represent tailfin length in (D) (n = 14 mem/+, 14 mem; 17 mem/+, 15 mem; 15 mem/+, 15 mem; 15 mem/+, 14 mem; 14 mem/+, 13 mem; and 15 sde1/+, 15 sde1; mean ± SD; Student’s t test; ∗∗∗p < 0.001; ∗∗p < 0.01; ∗p < 0.05). (E) Left: illustration of ventral fin lobe amputation. Right: schematic timeline of temperature shifts after fin amputation is shown. Red bar indicates the period of incubation at 33°C. (F) Whole-mount images of mem at 21 dpa after amputation of the ventral fin lobe. Red dashed lines depict a mirrored margin of the contralateral dorsal fin lobe (without amputation). Scale bar, 1 mm. (G and H) Measurement of the relative fin lobe size (G) and fin length (H; ventral/dorsal) in the same animal (n = 16 mem/+, 16 mem; mean ± SD; Student’s t test; ∗∗∗p < 0.001). (I) Whole-mount images of wild-type (WT) fin regenerates at 3 dpa after staining with Alizarin red for calcium deposition. White dashed box indicates the enlarged area in (J). Red arrows indicate amputation plane. Scale bar, 1 mm. (J) Enlarged view of Alizarin red staining image at 3, 7, and 21 dpa. White solid lines mark the length of the non-mineralized portion in bony rays. Images from the same individual are shown at different time points. Scale bar, 1 mm. (K) Measurement of the length of the non-mineralized portion in the second bony ray at 3, 7, and 21 dpa (n = 6; mean ± SD). The 2nd lateral bony ray from the ventral side was measured as a representative. Black dashed line indicates a cutoff value that defines full mineralization of mature bony rays. (L) Whole-mount images of a mem fin regenerate at 21 dpa after staining with Alizarin red. White dashed lines indicate amputated fin regions. Right: enlarged views of the uninjured dorsal (D) and regenerated ventral (V) fin lobes are shown. White solid line marks the length of the non-mineralized bone portion. Scale bars, 1 mm. (M) Measurement of the length of the non-mineralized bone portion at 21 dpa (n = 15; mean ± SD). The 2nd lateral, uninjured bony ray on dorsal fin lobes was measured for comparison. Black dashed line indicates a cutoff value that defines full mineralization in mature bony rays. PHENOTYPE:
|
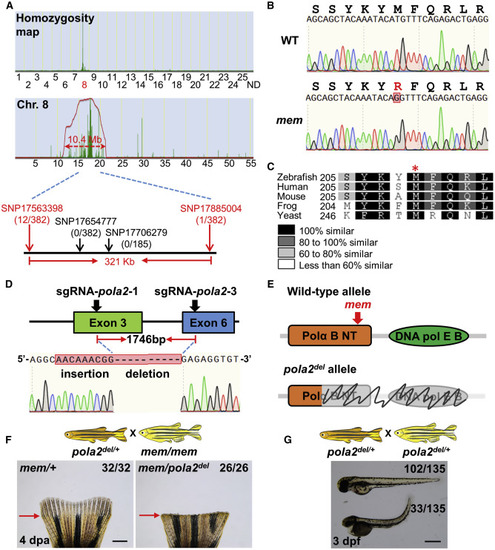
pola2 Is the mem Gene (A) Analysis of genomic homozygosity in mem using SNPtrack. High-resolution mapping of linked SNP markers identified twelve recombinants for SNP17563398 and one recombinant for SNP17885004 separated by a 321-kb region. After genotyping 382 adult animals, no recombinants were found for SNP17654777 or SNP17706279. (B) Sanger sequencing readouts from WT and mem cDNA. SNP17700243 is a novel SNP located in the coding region of the gene DNA polymerase alpha subunit 2 (pola2); it encodes a methionine to arginine substitution. (C) Amino acid alignment across distant species. Red asterisk marks the location of the conserved methionine that is mutated in the mem locus. Differential gray scale shows level of conservation across listed species. (D) Illustration depicting the pola2 genomic sequence we targeted with CRISPR/Cas9. A 1,746-bp deletion was detected by Sanger sequencing of a stable line. (E) Illustration depicting two major structural domains of pola2: DNA polymerase alpha subunit B N-terminal (Polα B NT) and DNA polymerase alpha/epsilon subunit B (DNA pol E B). Top: red arrow indicates the location of the mem mutation. Bottom: gray color and scribble lines indicate structural domains that are removed in the pola2del allele. (F) Complementation assays showing that pola2del allele fails to complement the mem phenotype in adult animals. Approximately 50% of animals (26 out of 58) displayed a complete regeneration block at the restrictive temperature at 4 dpa, as expected from Mendelian ratios. The phenotypes, genotypes, and ratios were consistent across 4 independent crosses (n = 92 in total). Red arrows indicate amputation plane. Scale bar, 1 mm. (G) Representative images of embryos from a pola2del/+ × pola2del/+ cross. Approximately 25% of embryos (33 out of 135) showed developmental defects at 3 dpf (days post-fertilization), consistent with the expected Mendelian ratio. Scale bar, 0.5 mm. See also Figure S2. PHENOTYPE:
|
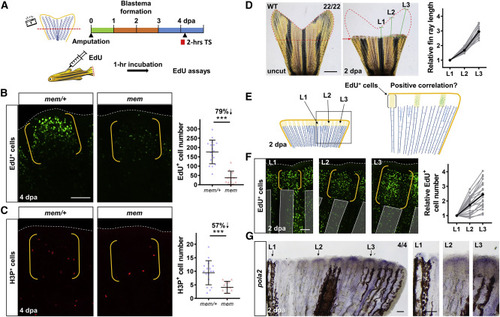
Active pola2 Is Required for Appropriate Blastemal Proliferation and Encoding of Positional Information in Fin Regenerates (A) Schematic timeline of the 2-h heat treatment at 4 dpa. TS, temperate shift. Green bar indicates the wound healing phase. Orange bar indicates the blastema formation phase. Blue bar indicates the regenerative outgrowth phase. Red bar indicates the period of heat treatment at the restrictive temperature (33°C). Following the heat treatment, EdU was injected intraperitoneally 1 h prior to collection of fin regenerates. (B) Whole-mount EdU staining images of mem fin regenerates at 4 dpa after a 2-h incubation at 33°C. White dashed lines outline the distal edge of the fin. Yellow brackets mark the blastema compartment. Scale bar, 100 μm. Right: quantification of EdU-positive cells in the lateral 2nd bony ray (n = 17 mem/+, 12 mem; mean ± SD; Student’s t test; ∗∗∗p < 0.001). (C) Whole-mount H3P staining images of mem fin regenerate at 4 dpa after a 2-h stay at 33°C. White dashed lines outline the distal edge of the fin. Yellow brackets mark the blastema compartment. Right: quantification analysis of H3P-positive cells in the lateral 2nd bony ray (n = 17 mem/+, 12 mem; mean ± SD; Student’s t test; ∗∗∗p < 0.001). (D) Whole-mount images of WT tailfin taken before amputation and at 2 dpa. Red dashed lines depict tailfin tissues that were removed by the amputation. Red arrows indicate amputation plane. Green solid lines indicate individual bony ray lengths to be regenerated upon completion of regeneration; L1, the 9th lateral bony ray from the ventral side; L2, the 6th lateral bony ray; L3, the 3rd lateral fin ray. Scale bar, 1 mm. L2 and L3 bony ray lengths were normalized to the L1 value from the same individual (n = 22; gray dots mark values from each fin tissues). Black dots denote the mean value. (E) Illustration depicting a possible model for the relative number of proliferating blastema cells at 2 dpa. The proliferating cell number at 2 dpa may be predictive of the bony ray lengths to be regenerated. (F) Whole-mount EdU staining of L1, L2, and L3 regenerates in WT at 2 dpa. White dashed lines outline the distal edge of the fin. Yellow brackets mark a single blastema compartment. Transparent gray bars mark bony rays. Images shown are from the same individual. Scale bar, 100 μm. Quantification of EdU+ cell number in L1, L2, and L3 bony rays is shown. The number of blastema cells in L2 and L3 was normalized to the number in L1 from the same individual (n = 22; gray dots mark values from each fin tissue). Black dots denote the mean value. (G) Whole-mount RNA in situ hybridization of pola2 in a representative WT fin regenerate at 2 dpa (n = 4). Right: enlarged view of L1, L2, and L3 is shown. Scale bars, 100 μm. See also Figure S3. |
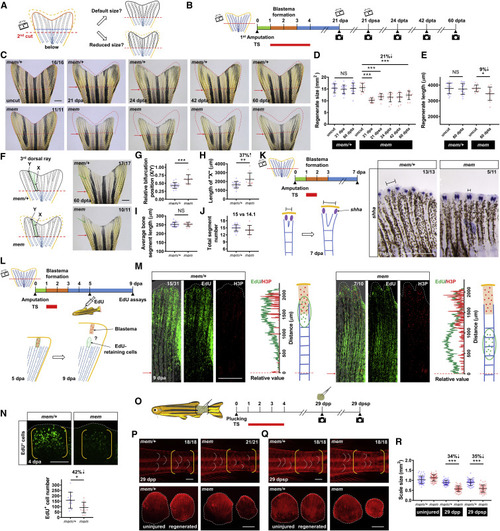
Reprogrammed Positional Information in mem Regenerates Is Transferable to Subsequent Cycles of Injury/Regeneration (A) Illustration depicting possible outcomes for fin regenerate size after a second amputation. After development of a miniature tailfin following the first amputation, a second amputation below the first amputation plane may either restore default fin size or recall the reprogrammed size. Blue dashed line indicates the first amputation plane. Red dashed lines indicate the second amputation plane. (B) Schematic timeline of temperature shifts after fin amputation. A second amputation was performed at approximately one bone segment below the first amputation plane at 21 dpa. A third amputation was performed at approximately one bone segment below the second amputation plane at 21 days post-second amputation (dpsa). Green bar indicates the wound healing phase. Orange bar indicates the blastema formation phase. Blue bar indicates the regenerative outgrowth phase. Red bar indicates the period of incubation at the restrictive temperature (33°C). dpta, days post-third amputation. (C) Whole-mount images of mem fin regenerates. Images of uncut, 21 dpa, 24 dpta, 42 dpta, and 60 dpta of the same animals are shown across sequential amputations. Red dashed lines depict tailfin region removed by the first amputation to facilitate visual comparison across different time points. Red arrows indicate amputation plane. Scale bar, 1 mm. (D and E) Measurement of mem fin regenerate size (D) and length (E) at different time points (n = 16 mem/+, 11 mem; mean ± SD; Student’s t test; ∗∗∗p < 0.001; ∗p < 0.05). (F) Illustration depicting bifurcation points in the 3rd dorsal bony ray. X indicates the length between the amputation plane and the first bifurcation point distal to the plane; Y indicates total regenerate length. Whole-mount images of mem fin regenerates at 60 dpta. Green arrows indicate the first bifurcation point. Red arrows indicate the amputation plane. Scale bar, 1 mm. (G–J) Measurements were made of the (G) relative position of the first bifurcation point (X/Y), (H) the absolute length of “X,” (I) the average length of bone segments (Y/number of segments), and (J) total segment number (n = 17 mem/+, 10 mem; mean ± SD; Student’s t test; ∗∗∗p < 0.001; ∗∗p < 0.01). (K) Schematic timeline of temperature shifts after fin amputation. (Below) Illustration depicting epithelial domains of shha during regeneration is shown. Right: whole-mount RNA in situ hybridization in mem/+ and mem fin regenerates at 7 dpa (n = 13 mem/+, 11 mem) is shown. Black solid lines mark the distance between two separated shha signals in each bony ray. Scale bar, 0.5 mm. (L) Schematic timeline of temperature shifts after fin amputation. (Below) Illustration depicting labeling and tracking of EdU-retaining cells is shown. A brief 24-h inactivation of pola2 was performed at 1 dpa. EdU was injected intraperitoneally at 5 dpa to label blastema cells. Tailfin tissues were collected at 9 dpa for EdU assays and H3P immunostaining. H3P signal was used as a marker of the blastemal zones at 9 dpa. (M) Whole-mount EdU and H3P immunostaining of mem/+ and mem fin regenerates at 9 dpa. White dashed lines outline the distal edge of the fin. Red arrows and dashed lines indicate the amputation plane. Relative fluorescence value distribution of EdU-retaining cells and H3P-positive cells was assessed along the proximodistal axis of the same bony ray (n = 31 mem/+, 10 mem). Scale bar, 0.5 mm. (N) Whole-mount EdU staining of mem miniature fin regenerates at 4 dpa. White dashed lines outline the distal edge of the fin. Yellow brackets mark the blastema compartment. Scale bar, 100 μm. Bottom: quantification analysis of EdU-positive cells in the lateral 2nd bony ray is shown (n = 12 mem/+, 12 mem; mean ± SD; Student’s t test; ∗p < 0.05). (O) Illustration depicting scale plucking experiment; 15–20 scales were removed from each adult individual with surgical forceps. Schematic timeline of temperature shifts after scale plucking is shown. dpp, days post plucking; dpsp, days post-second plucking. (P) Top: whole-mount images of mem scale regenerates at 29 dpp after staining with Alizarin red. White dashed lines indicate posterior margins of three representative scales in the plucked and control regions. Yellow brackets mark regions of scale plucking on the fish body surface. Scale bar, 1 mm. Bottom: images of plucked scales are shown. White dashed lines indicate outline of the scales. Scale bar, 0.5 mm. (Q) Top: whole-mount images of mem scale regenerates at 29 dpsp after staining with Alizarin red. White dashed lines indicate posterior margins of three representative scales in the plucked and control regions. Yellow brackets mark regions of scale plucking on the fish body surface. Scale bar, 1 mm. Bottom: images of plucked scales are shown. Scale bar, 0.5 mm. (R) Measurement of mem and mem/+ scale size at 29 dpp and 29 dpsp. Three scales were removed from each individual for imaging and quantification (n = 55 mem/+, 66 mem for uninjured scales; n = 55 mem/+, 63 mem for the first regenerated scales; n = 55 mem/+, 58 mem for the second regenerated scales; mean ± SD; Student’s t test; ∗∗∗p < 0.001). See also Figures S4, S5, and S6. PHENOTYPE:
|
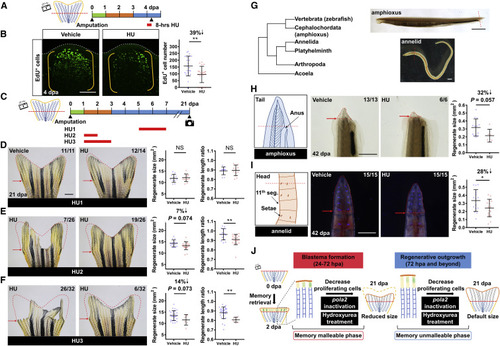
Transient Inhibition of DNA Synthesis and Blastemal Cell Proliferation Impacts Positional Memory in Diverse Animal Species (A) Schematic timeline of hydroxyurea (HU) treatment after fin amputation. Green bar indicates the wound healing phase. Orange bar indicates the blastema formation phase. Blue bar indicates the regenerative outgrowth phase. Red bar indicates the period of HU treatment. (B) Whole-mount EdU staining of WT fin regenerates at 4 dpa after an 8-h treatment with HU. White dashed lines outline the distal edge of the fin. Yellow brackets mark the blastema compartment. Scale bar, 100 μm. Right: quantification of EdU-positive cells in the lateral 2nd bony ray is shown (n = 22 mem/+, 22 mem; mean ± SD; Student’s t test; ∗∗p < 0.01). (C) Schematic timeline of HU treatment after fin amputation. Red bars indicate the periods of HU treatment. (D–F) Whole-mount images of HU-treated WT tailfin regenerate at 21 dpa; (D) HU1, (E) HU2, and (F) HU3 treatment. Red dashed lines depict average regenerate size in vehicle-treated animals to facilitate visual comparison. Red arrows indicate amputation plane. Scale bar, 1 mm. Right: quantification of regenerate size and length ratio (i.e., regenerated fin length versus uninjured fin length of the same animal) at 21 dpa (n = 11 vehicle, 12 HU for HU1; 15 vehicle, 19 HU for HU2; 29 vehicle, 6 HU for HU3; mean ± SD; Student’s t test; ∗∗p < 0.01). Only tailfin tissues displaying no regeneration block after HU treatment were included in the analysis. (G) A phylogenetic tree of relevant animals. Zebrafish, amphioxus, and annelids were examined in this study. Right: red dashed lines indicate amputation planes in amphioxus and annelids. Scale bars, 1 mm. (H) Illustration depicting amputation plane in amphioxus. Tail amputation was performed posterior to the anus. Middle: whole-mount images of amphioxus tail regenerates at 42 dpa are shown. Red dashed lines depict the tail regenerates. Red arrows indicate amputation plane. Scale bar, 1 mm. Right: quantification analysis of the tail regenerate size is shown (n = 13 vehicle, 6 HU; mean ± SD; Student’s t test). (I) Illustration depicting amputation plane in annelids. Head amputation was performed at the 9th segment, which was recognized by the absence of setae on the ventral side of the 11th segment. Middle: Whole-mount images of annelid head regenerates at 42 dpa are shown. Red dashed lines depict the head regenerates. Red arrows indicate amputation plane. Scale bar, 0.5 mm. Right: quantitative analysis of the head regenerate size is shown (n = 15 vehicle, 15 HU; mean ± SD; Student’s t test; ∗p < 0.05). (J) Preliminary model for regulation of positional information. PHENOTYPE:
|

ZFIN is incorporating published figure images and captions as part of an ongoing project. Figures from some publications have not yet been curated, or are not available for display because of copyright restrictions. EXPRESSION / LABELING:
|