
- Title
-
Oligodendrocyte Neurofascin Independently Regulates Both Myelin Targeting and Sheath Growth in the CNS
- Authors
- Klingseisen, A., Ristoiu, A.M., Kegel, L., Sherman, D.L., Rubio-Brotons, M., Almeida, R.G., Koudelka, S., Benito-Kwiecinski, S.K., Poole, R.J., Brophy, P.J., Lyons, D.A.
- Source
- Full text @ Dev. Cell
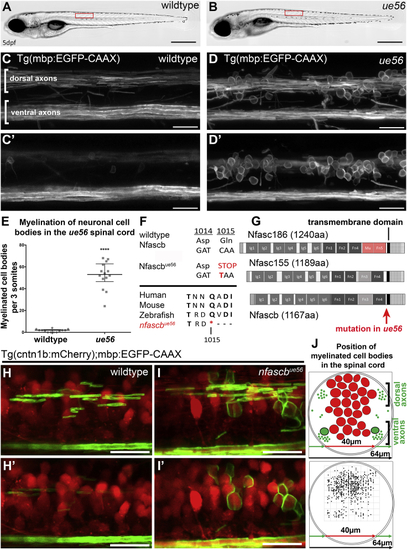
(A and B) Images of wild type (A) and (C–D′) Confocal images of myelin in a wildtype larva (C and C′) and (E) Quantitation of myelinated cell body number in wildtype and (F) Sequence at amino acid positions where the (G) Schematic of predicted domain structure of mouse neurofascin 186, neurofascin 155, and zebrafish neurofascin B, with indication of where the mutation in (H–I′) Z projections of confocal images of neurons (red) and myelin (green) in a wildtype animal (H and H′) and (J) Schematic cross section of the larval zebrafish spinal cord denoting areas with cell bodies (red) and myelinated axons (green) (Top panel). Dorso-ventral and medio-lateral positions of all myelinated cell bodies (dots) in a 3-somite long stretch of spinal cord of 11 mutants (bottom panel). |
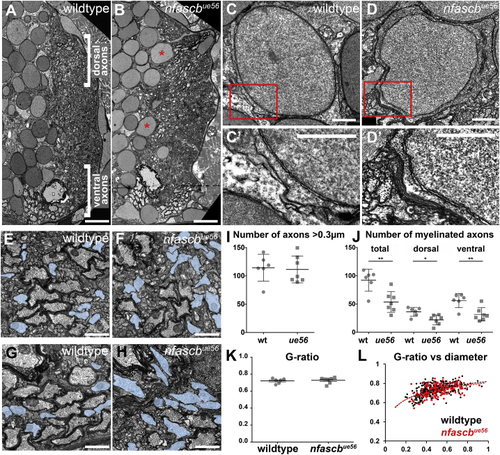
Ultrastructural Analyses of the (A and B) Transmission electron microscopy (TEM) images of sections through the spinal cord of wildtype (A) and (C–D′) TEM images of cell bodies in wildtype (C and C′) and (E–H) High magnification views of myelinated axons in the dorsal (E and F) and ventral (G and H) spinal cord of wildtype (E) and mutant (F) animals. Unmyelinated axons with a diameter >0.3 μm highlighted in blue. Scale bars, 0.5 μm. (I) Number of axons with a diameter > 0.3 μm in wildtype and (J) Total number of myelinated axons in wildtype and (K) Average g-ratio per animal in wildtype and (L) G-ratios of all myelinated axons assessed in the dorsal spinal cord of wildtype (black) and PHENOTYPE:
|

Neurofascin Functions in Oligodendrocytes to Regulate Myelin Targeting (A) Real-time PCR analyses of the expression of (B) Confocal images of Nfascb-GFP with cells counterlabelled with mRFP showing concentration of NfascB-GFP at the tips of myelin sheaths (b1-3), where paranodal junctions are localized. Scale bar, 5 μm (top panel) and 2.5 μm (b1-3). (C and D) Confocal images of single oligodendrocytes expressing Nfascb-GFP in wild type (C) and (E–G) Analysis of myelination in mice lacking (E and F) Confocal images of the dorsal horn where assessments for myelination of cell bodies was carried out in control ( (G) Quantitation of myelinated cell body number in controls and EXPRESSION / LABELING:
|

Oligodendrocyte Neurofascin Regulates Both Myelin Targeting and Sheath Length (A–D) Confocal images of single oligodendrocytes labeled mosaically using mbp:mCherry-CAAX in wildtype (A), two (E–G) Number of myelinated cell bodies (E) and myelin sheaths (F) and the average length of myelin sheaths (G), made by individual oligodendrocytes in wildtype, (E) Myelination of cell bodies is increased in both (F) Number of myelin sheaths per oligodendrocyte is similar in wildtype, (G) Average sheath length per oligodendrocyte in wildtype, (H) Average sheath length per oligodendrocyte in wildtype and mutant oligodendrocytes with no myelinated cell bodies (wildtype mean 32.11 ± 1.50 SEM, n = 20, (I) Average sheath length per oligodendrocyte in (E–I) n in all cases refers to animals. (J and K) Confocal images of teased fiber preparations taken from wild type (K) and (L) Quantitation of myelin sheath length in |
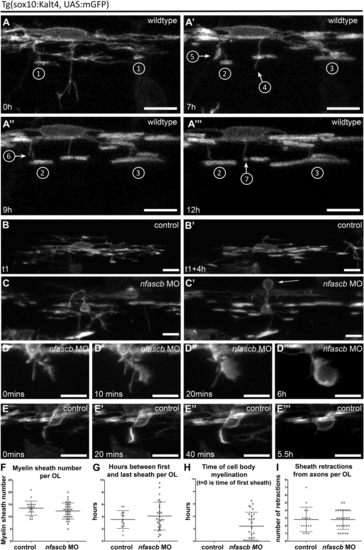
Neurofascin B Regulates Myelin Targeting during the Critical Period of Sheath Formation and Retraction (A–A″′) Single time-point images of an individual oligodendrocyte in a wild-type animal as its myelinating processes exhibit several distinct dynamic activities over time: 1=sheath formation, 2=slow sheath growth, 3=rapid sheath growth, 4=exploratory process retraction, 5=engagement with a cell body, 6=retraction from a cell body, 7=retraction from an axon. Scale bar, 10 μm. (B and B′) Single time-point confocal images of an individual oligodendrocyte in a wildtype animal as it is forming myelin sheaths at the beginning (A) and toward the end (A′) of the critical period. Scale bar, 10 μm. (C and C′) Single time-point confocal images of an individual oligodendrocyte in a (D–D″′) Time series showing myelination of a cell body in a (E–E″′) Time series showing a myelinating process being retracted from a cell body in a control. Scale bar, 10 μm. (F) Number of myelin sheaths generated on axons per oligodendrocyte during time-lapse analyses of control and (G) Graph showing the duration between the first formed and the last formed myelin sheath by individual oligodendrocytes in control and (H) Time of cell body myelination during time-lapse of control (none were myelinated) and (I) Number of myelin sheaths retracted from axons per oligodendrocyte during time-lapse of control and |
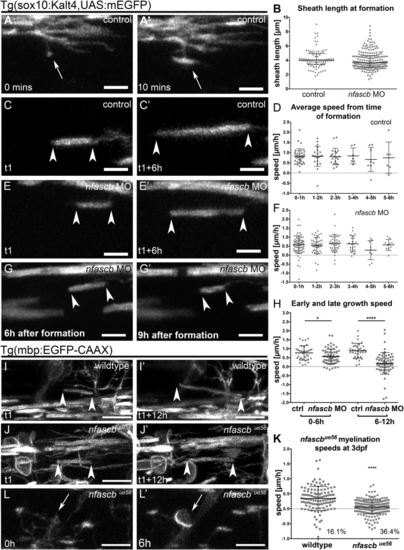
Neurofascin B Regulates Myelin Sheath Elongation and Stability (A and A′) Single time-point confocal images of a myelinating process in a Tg(sox10KalTA4, UAS mEGFP) control that makes contact with a target axon (A) and transitions into a recognizable myelin sheath (A′). Scale bar, 5 μm. (B) Average length of myelin sheaths immediately upon formation in control and (C and C′) Confocal images of a myelin sheath elongating over time during the period of sheath formation in a control animal. Arrowheads in all panels denote ends of myelin sheaths. Scale bar, 5 μm. (D) Average speed of individual sheath elongation in controls over a 12-h period, starting from the hour of their formation during the critical period. Each point represents a single sheath, imaged across 13 animals. No significant difference in speed of growth based on time of sheath formation, p = 0.8933, Kruskal-Wallis test. (E and E′) Single time-point confocal images of a myelin sheath elongating over time during the critical period of sheath formation in an (F) Average speed of sheath elongation in (G and G′) Single time-point confocal images of a myelin sheath shrinking over time after the critical period in a (H) Speed of elongation of individual myelin sheaths in control and (I and I′) Confocal images of a myelin sheath elongating in a wildtype animal. Scale bar, 10 μm. (J and J′) Confocal images of a myelin sheath elongating in an (K) Speed of myelin sheath elongation in Tg(mbp:EGFP-CAAX) wildtype and (L) Cell body myelination in EXPRESSION / LABELING:
PHENOTYPE:
|

Caspr Regulates Myelin Sheath Elongation and Stability, but Not Targeting (A and B) Confocal images of single oligodendrocytes labeled mosaically using mbp:mCherry-CAAX in wildtype (A) and (C–E) Number of myelinated cell bodies (C), number of myelin sheaths (D), and the length of myelin sheaths (D), made by individual oligodendrocytes in wildtype, het, and (C) Myelination of cell bodies is increased slightly in (D) Number of myelin sheaths per oligodendrocytes is similar in wildtype, (E) Myelin sheath length is reduced in (F and G) Confocal images of the dorsal horn of the spinal cord in wildtype (F) and Caspr mutant (G) mice, indicating the region indicated by dashed lines wherein myelinated cell bodies were searched for. Scale bar, 50 μm. (F′ and G′) Higher magnification views of regions within the dorsal horn of wild type (F′) and (H) Graph showing that essentially no myelinated cell bodies were observed in wild type or (I and J) Confocal images of teased fiber preparations taken from wild type (I) and Caspr mutant (J) mice, stained with antibodies that detect Kv1.1 (red), Neurofascin 186 (green), and neurofilament 200 (red). Scale bars, 25 μm. (K) Quantitation of myelin sheath length in Caspr mutant mice. Caspr internode lengths are reduced compared to wild type; wild type mean 310.7 ± 5.32 SEM, n = 5, Caspr 226.5 ± 8.96 SEM, n = 5 animals, 50 internodes per mouse, p < 0.0001, t test. (L and L″) Confocal images of a myelin sheath elongating in a wildtype Tg(mbp:EGFP-CAAX) animal. Scale bar, 10 μm. (M and M′) Confocal images of a myelin sheath elongating in a (N) Speed of myelin sheath elongation in wildtype and EXPRESSION / LABELING:
PHENOTYPE:
|
Reprinted from Developmental Cell, 51(6), Klingseisen, A., Ristoiu, A.M., Kegel, L., Sherman, D.L., Rubio-Brotons, M., Almeida, R.G., Koudelka, S., Benito-Kwiecinski, S.K., Poole, R.J., Brophy, P.J., Lyons, D.A., Oligodendrocyte Neurofascin Independently Regulates Both Myelin Targeting and Sheath Growth in the CNS, 730-744.e6, Copyright (2019) with permission from Elsevier. Full text @ Dev. Cell