
- Title
-
Drug Screen Identifies Leflunomide for Treatment of Inflammatory Bowel Diseases Caused by TTC7A Deficiency
- Authors
- Jardine, S., Anderson, S., Babcock, S., Leung, G., Pan, J., Dhingani, N., Warner, N., Guo, C., Siddiqui, I., Kotlarz, D., Dowling, J.J., Melnyk, R., Snapper, S.B., Klein, C., Thiagarajah, J.R., Muise, A.M.
- Source
- Full text @ Gastroenterology
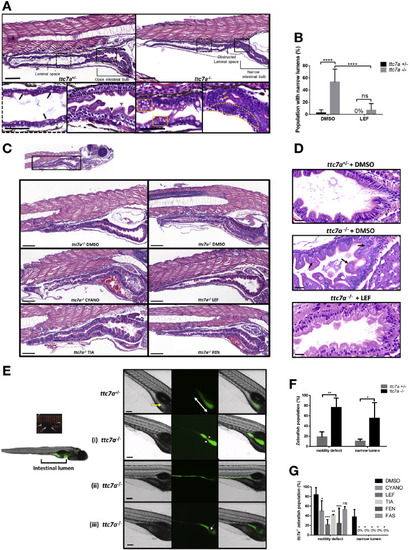
Leflunomide rescues abnormal intestinal features in ttc7a–/–zebrafish. (A) Histology from ttc7a–/– zebrafish (7 dpf) shows pathologic intestinal phenotypes. Control (ttc7a+/–) zebrafish display open luminal spaces with discernible villi projections (gray arrowhead), clefts (black arrowhead), monolayer epithelium (dotted-outlined area), and mature goblet cells with large vesicles (black arrows). The ttc7a–/– zebrafish display narrowing of the intestinal bulb, stratified epithelium (yellow dotted-outlined area), signs of apoptosis (yellow arrows), and goblet cells with numerous small vesicles (yellow boxes). Original objective magnification, ×10 and ×40 for insets (scale bar, 100 μm; inset scale bar, 50 μm) (ttc7a+/–: N = 14, ttc7a–/–: N = 11). (B) Incidence of the narrow gut phenotype in DMSO- and LEF-treated fish. One-way ANOVA with post hoc test (Fisher least significant difference), ****P < .0001; (ttc7a+/–: DMSO, N = 49; LEF, N = 12; ttc7a–/–: DMSO, N = 36; LEF, N = 26). (C) Intestinal histology from treated (see Methods) ttc7a–/– zebrafish. Leflunomide, cyanocobalamin, and tiaprofenic acid suppressed the narrow-gut phenotype with minimal enterocyte crowding. Original objective magnification, ×10 (scale bar, 100 μm) (ttc7a+/–: DMSO, N = 49; ttc7a–/–: DMSO, N = 36; CYANO, N = 10; LEF, N = 26; TIA, N = 13; FEN, N = 13). (D) Assessment of apoptosis. DMSO or leflunomide treatment. ttc7a–/– zebrafish display fragmented, condensed, or engulfed nuclei in the epithelium (arrows). Leflunomide treatment resulted in diminished signs of apoptosis, reduced intestinal epithelial cell crowding, and overall improved epithelium architecture in ttc7a–/– zebrafish. Refer to Supplementary Figure 7A for the quantitation of apoptotic cells/sample. Objective magnification, ×70 (scale bar, 20 μm) (n = 6 per group, across 3 experimental clutches). (E) Staining of the intestinal lumen in control (ttc7a+/–) and ttc7a-mutant (ttc7a–/–) zebrafish. Images are from peristalsis assays (Supplementary Video 2): intestinal lumen marked by green fluorescent stain, 2′,7′-dichlorodihydrofluorescein diacetate (DCFH-DA). The ttc7a+/– fish have discernable villi (yellow arrow) and large continuous intestinal bulbs (double-headed white arrow). Representative ttc7a–/–intestinal phenotypes (i) atresia point (white arrow heads) (ii) narrow intestinal lumen and (iii) obstruction interrupting the intestinal bulb (white arrow). Objective magnification ×4 (scale bar, 100 μm). (F) Incidence of ttc7a-mutant phenotypes. The ttc7a–/– fish have significantly larger populations with motility and narrow lumen pathologic phenotypes. Data are presented as the mean ± standard deviation; 1-way ANOVA with post hoc test (Fisher least significant difference), **P < .0054, *P < .0196 (N = 50 total for each group, across 3 experimental clutches). (G) Phenotype summary from drug-treated fish. The ttc7a–/– fish with aberrant motility and narrow lumen phenotypes were significantly reduced with cyanocobalamin, leflunomide, tiaprofenic acid, and fenbufen treatment (3–7 dpf). Data are presented as the mean ± standard deviation. Statistical significance was relative to ttc7a–/– DMSO control and determined by 2-way ANOVA with post hoc test (Dunnett) *P < .05, **P < .01, ***P < .001 (DMSO: N = 18; CYANO: N = 21; LEF: N = 21; TIA: N = 17; FEN: N = 18; FAS: N = 13 for each group across 3 experimental clutches). CYANO, cyanocobalamin; FAS, fasudil; FEN, fenbufen; LEF, leflunomide; M, mol/L; ns, not significant; RLU, relative light units; TIA, tiaprofenic acid. PHENOTYPE:
|
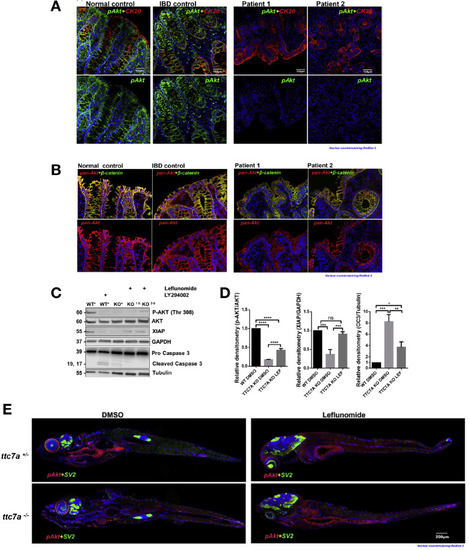
p-AKT is reduced in TTC7A deficiency. (A) Histopathology analysis of p-AKT in human colon tissue. Costaining of CK20, a marker for the intestinal epithelium, and p-AKT is present in the normal and IBD control samples, whereas p-AKT is diminished in patients with TTC7A-deficiency. Patient 1 is the colonoid donor, and patient 2 is unpublished with confirmed biallelic mutations. RedDot 2 nuclear counterstain (blue). Sections were originally magnified at ×20 objective. (B) Histopathology analysis of pan-AKT (total AKT) in human colon tissue. Biopsy samples are the same as those described in Figure 5A. Pan-AKT is present in all samples, albeit with reduced intensity in the TTC7A-deficiency patient samples. Sections were originally magnified at ×20 objective. (C) Immunoblot for p-AKT, XIAP, and cleaved caspase 3 in WT and TTC7A-KO cells. After 3 hours, leflunomide treatment in TTC7A-KO cells, p-AKT, and XIAP protein levels are detectable, whereas cleaved caspase 3 is diminished. Asterisk indicates DMSO (n = 3). (D) Densitometric analysis of p-AKT, XIAP, and cleaved caspase 3 from WT and TTC7A-KO cells. One-way ANOVA with post hoc test (Tukey); *P < .05, **P < .01, ***P < .001, ****P < .0001 (n = 3). (E) The ttc7a+/– and ttc7a–/– whole-mount zebrafish staining with p-AKT (red), synaptic vesicle protein 2 (SV2) (green), and RedDot 2 nuclear counterstain (blue). SV2 staining, indicating neuromuscular junctions, is absent from the intestinal epithelial monolayer and aids in differentiating epithelial cells from other nearby cell types. In the DMSO-treated panel, p-AKT staining (Ser473) in ttc7a+/– fish is evident along the gastrointestinal tract but absent in ttc7a–/– fish. Leflunomide treatment (3-7 dpf) restores p-AKT staining in the intestinal epithelium of ttc7a–/– fish. Fish were originally magnified at ×5 objective (n = 4). |

Leflunomide treatment enhances survival and function of TTC7A-deficiency patient colonoids. (A) A personalized medicine approach to evaluate drug efficacy in human TTC7A deficiency using patient-derived colonoids. Endoscopic biopsy samples were obtained from healthy control individuals and patients with TTC7A deficiency (E71K and L304R compound heterozygous, TTC7Amut) and cultured into colonoids, which were then tested with leflunomide. (B) Leflunomide improves the survival of human colonoids derived from patients with TTC7A-deficiency (TTC7Amut). Example images of control (TTC7A+/+) and TTC7A-deficient (TTC7Amut) colonoids with and without leflunomide (10 μmol/L) treatment at 2 and 6 days and grown in the absence of ROCK inhibitor (Y27632). Red arrows indicate examples of dead colonoids. (C) Summary graph showing the percentage of dead TTC7Amut colonoids with and without leflunomide treatment. TTC7Amut and TTC7A+/+ colonoids were cultured with and without ROCK inhibitor (Y27632) or with leflunomide, and viability was assessed at days 2 and 6. TTC7Amut colonoids grown without ROCK inhibitor have significantly increased death, which is reversed after leflunomide treatment. One-way ANOVA with post hoc test (Tukey-Kramer); *P < .05. **P < .01. (D) Immunofluorescence staining of TTC7A+/+ and TTC7Amutcolonoids with villin (green) marking the apical brush border and CK20 (red) marking basal epithelial structure and DAPI (blue, nuclei). TTC7A+/+colonoids show normal polarity with defined basal CK20 staining. TTC7Amut colonoids treated with ROCK inhibitor show grossly normal staining with mild cytological atypia. TTC7Amut colonoids without ROCK inhibitor show normal sidedness but abnormal polarity with cytological atypia and basal structural abnormalities, which is improved in leflunomide-treated colonoids. Quantification of abnormal polarity, as assessed by the presence of multiple lumens in colonoids. Percentage of colonoids with multiple lumens in TTC7A-deficient colonoids with and without leflunomide (10 μmol/L). Healthy control colonoids did not have multiple lumens (data not shown). Two tailed t test, *P < .05. (E, F) TTC7A-deficient colonoids (TTC7Amut) have a reduced swelling response to forskolin stimulation. Example images showing reduced swelling in TTC7Amut compared with TTC7Amut treated with leflunomide (10 μmol/L). The inset panel shows magnified images, with red arrows indicating example colonoids before and after swelling. Summary data show significantly increased swelling in leflunomide (10 μmol/L)-treated TTC7Amut colonoids. Two-tailed t test, **P < .01. |

ZFIN is incorporating published figure images and captions as part of an ongoing project. Figures from some publications have not yet been curated, or are not available for display because of copyright restrictions. |