
- Title
-
Early sarcomere and metabolic defects in a zebrafish pitx2c cardiac arrhythmia model
- Authors
- Collins, M.M., Ahlberg, G., Hansen, C.V., Guenther, S., Marín-Juez, R., Sokol, A.M., El-Sammak, H., Piesker, J., Hellsten, Y., Olesen, M.S., Stainier, D.Y.R., Lundegaard, P.R.
- Source
- Full text @ Proc. Natl. Acad. Sci. USA

Loss of Pitx2c disrupts cardiac function and structure in adult zebrafish. (A–E) Analysis of cardiac function by echocardiography. Brightfield-Mode (B-Mode) imaging of long-axis views was used to quantify FAC and FS. Pulsed-wave Doppler imaging (A) was used to quantify peak A VTI and mean blood flow velocity (E). Individual data points represent an average measurement taken from 3 diastolic/systolic phases of each fish. All parameters of cardiac function are significantly reduced in pitx2c−/− adults, with variability observed in pitx2c+/− siblings. (F–N) Adult cardiac morphology at 14 months postfertilization (mpf). Dashed lines outline the atrium in whole-mount view of hearts (F, I, and L). Histology was analyzed by hematoxylin and eosin (H&E) staining (G, J, and M; Insets show higher magnification of the boxed region), and fibrosis was analyzed by Acid Fuchsin Orange G (AFOG) staining (H, K, and N; higher magnification of the boxed regions are shown in H’, K’, and N’). pitx2c−/− hearts display enlarged and blood-filled atria (L), and atrial tissue appears hypertrophic (M, Inset). Fibrotic foci are present in the atrium of pitx2c−/− fish (N′; black arrowheads). Intermediate phenotypes were observed in pitx2c+/− hearts. at, atrium; ba, bulbus arteriosus; v, ventricle. (O–T) TEM images of adult pitx2c+/+ and pitx2c−/− atria (n = 3). Areas of highly damaged and necrotic tissue are observed in pitx2c−/− atria, with an increased number of mitochondria that appear enlarged and defective (P; yellow arrowheads). Representative images of cross-sections through myofibril bundles (Q and R; Q, Inset and R, Inset show higher magnifications) and longitudinal sections of sarcomeres (S and T). pitx2c−/− atria exhibit disorganized myofibril bundles and poorly defined Z discs (yellow arrowheads), and M lines (red arrows) are difficult to distinguish (T). Error bars indicate SEM. *P < 0.05 by unpaired t test; **P < 0.01 by unpaired t test. PHENOTYPE:
|

ZFIN is incorporating published figure images and captions as part of an ongoing project. Figures from some publications have not yet been curated, or are not available for display because of copyright restrictions. PHENOTYPE:
|

Mitochondrial and metabolic changes in pitx2c−/− adult atria. (A) Quantification of relative mtDNA content in pitx2c+/+ and pitx2c−/− atria by qPCR. (B) Representative image of mitochondrial clusters (highlighted in green) observed in pitx2c−/− adult hearts by TEM (n = 3). (C) qPCR of known PITX2 targets as well as additional metabolic genes in pitx2c+/+ and pitx2c−/− adult atria. Significant down-regulation of cox7c, ppargc1a, foxo1a, pparaa, ucp1, and prdx5 mRNA levels and up-regulation of hcn4 and esrra as well as adipogenic genes fabp11a, adipor2, and zbtb16b mRNA levels are observed in pitx2c−/− atria (C). Error bars correspond to SEM. *P < 0.05 by unpaired t test; **P < 0.01 by unpaired t test. |
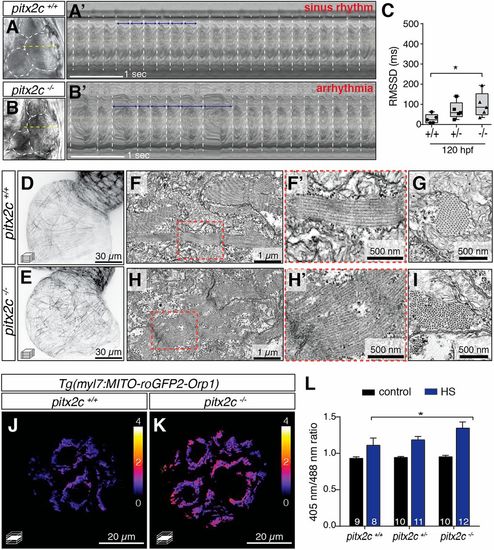
Cardiac arrhythmia in pitx2c−/− larvae is preceded by sarcomere and metabolic defects. (A–C) Analysis of heart rate variability in larval zebrafish using high-speed imaging. Bright-field images of 120-hpf pitx2c+/+ (A) and pitx2c−/− (B) hearts. Representative kymographs of sinus rhythm (A′) and arrhythmia (B′). White dashed lines mark each cardiac cycle; blue arrows denote the duration between consecutive contractions. Box-and-whisker plot of the RMSSD between consecutive cardiac cycles (C). Each data point represents the average interval calculated from 8 to 10 cardiac cycles of individual larvae. Increased variation is observed in pitx2c−/− larvae compared with pitx2c+/+ siblings. Error bars correspond to SEM from at least 2 independent experiments. *P < 0.05 by unpaired t test. (D and E) Confocal images of cardiac sarcomeres in 50-hpf Tg(myl7:LA-EGFP); pitx2c+/+ (D) and pitx2c−/− (E) siblings. (F–I) TEM images of 56-hpf hearts (n = 3); higher magnification of the region outlined in red is shown in F’ and H’. Embryonic sarcomeres appear wavy and less organized in pitx2c−/− compared with pitx2c+/+. (J–L) Redox-state analysis of 120-hpf pitx2c+/+ and pitx2c−/− atria expressing the Tg(myl7:MITO-roGFP2-Orp1) ROS biosensor. Calibration bar shows the relative 405-/488-nm ratio. (L) Quantification of 405-/488-nm ratios in control conditions or following a 1-h HS at 37 °C prior to imaging. Following HS, increased ROS levels were detected in all 3 genotypes; a stronger increase was observed in pitx2c−/− hearts, suggesting increased levels of oxidative stress compared with pitx2c+/+ siblings (L). Error bars correspond to SEM from at least 2 independent experiments. *P < 0.05 by unpaired t test. |
|
ZFIN is incorporating published figure images and captions as part of an ongoing project. Figures from some publications have not yet been curated, or are not available for display because of copyright restrictions. PHENOTYPE:
|