
- Title
-
Pretectal neurons control hunting behaviour
- Authors
- Antinucci, P., Folgueira, M., Bianco, I.H.
- Source
- Full text @ Elife

Neural activity associated with hunting.(A) 2-photon GCaMP imaging combined with behavioural tracking during virtual hunting behaviour (see Materials and methods). (B) Schematic of visual stimuli. (C) elavl3:H2B-GCaMP6s;atoh7:gapRFP reference brain showing imaging volume (green box), which encompassed most retinal arborisation fields (AF2–10). In the right hemisphere, RFP has been pseudo-coloured to demarcate specific AFs. (C’) Example of neuronal activity (ΔF/F0) within one focal plane in response to a dark, leftwards moving prey-like spot (mean activity over eight presentations) overlaid onto anatomical image (grey). (D) Example of behavioural tracking data indicating hunting initiation (eye convergence and leftwards J-turn) in response to a dark, leftwards moving prey-like spot. Asterisk indicates time of convergent saccade. cw, clockwise; ccw, counter-clockwise. (E) Distribution of spot locations at time of convergent saccade. Ticks indicates median location for leftwards (blue, –18.13°, N = 162 events in eight fish) and rightwards (red, 22.10°, N = 122 events) moving spots. (F) Hunting response probability (mean + SEM, N = 8 fish) across visual stimuli. (G) Schematic of the visuomotor vector (VMV) generated for each neuron. (H) VMVs of all clustered neurons (N = 93,054 neurons from eight fish). Within each cluster, neurons are ordered according to decreasing correlation with the cluster seed centroid (mean VMV). Coloured lines on the left highlight hunting-related clusters (prey-responsive clusters in blue, hunting-initiation clusters in red). (I) Enlargement showing VMVs of selected hunting-related clusters (1, 4, 25–28). Number of cells in each cluster is shown on right. (J) Stimulus-aligned activity during non-response (top) and response (bottom) trials for neurons in selected clusters (indicated top). (K) Hunting Index (HIx). Top schematic indicates how HIx is computed from calcium signals and bottom shows distribution of HIx scores for selected clusters. Scale bars, 100 µm. A, anterior; D, dorsal; L, leftwards; P, posterior; R, rightwards; V, ventral; Sym, symmetric. See also Figure 1—figure supplements 1 and 2 and Video 1. |

AF7-pretectum contains a high density of hunting initiation neurons. (A) Anatomical maps of prey-responsive clusters (left) and hunting-initiation clusters (middle and right). Images show dorsal views of intensity sum projections of all neuronal masks in each cluster after registration to the elavl3:H2B-GCaMP6s reference brain (grey). Insets show fraction of neurons in left and right AF7-pretectum or medial thalamus belonging to specified clusters. (B) Ventro-dorsal cross-section views of anatomical maps. (C) Visual stimulus-aligned activity during non-response trials for prey-responsive clusters (left) and hunting-initiation clusters (middle and right; mean ± SEM). Activity is displayed separately for left (blue) and right (red) hemisphere neurons in each cluster. Insets show single-trial responses for a single example cell from each cluster (mean as thick line). (D) Activity aligned to convergent saccades associated with leftwards (top), rightwards (bottom), or symmetrical/no tail movements (middle). Activity during both spontaneous and visually evoked events was used. Scale bars, 100 µm. A, anterior; D, dorsal; L, left; P, posterior; R, right; V, ventral; Stim, stimulus. |
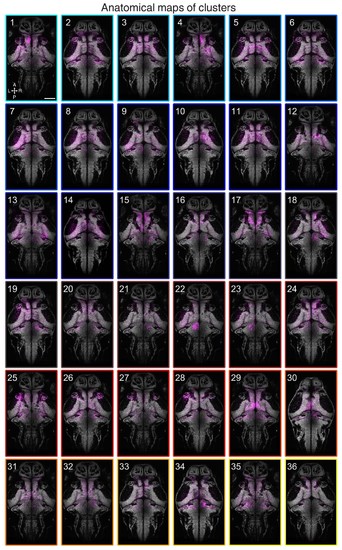
Anatomical maps of clusters.Images show dorsal views of intensity sum projections of all neuronal masks in each cluster (magenta) after registration to the elavl3:H2B-GCaMP6s reference brain. Projections (obtained through all focal planes,~100 µm total depth) are overlaid on a maximum-intensity projection image (grey) from the elavl3:H2B-GCaMP6s reference brain (five planes, 5 µm depth, from focal planes with the largest number of neurons in each cluster). Scale bar, 100 µm. A, anterior; L, left; P, posterior; R, right. |
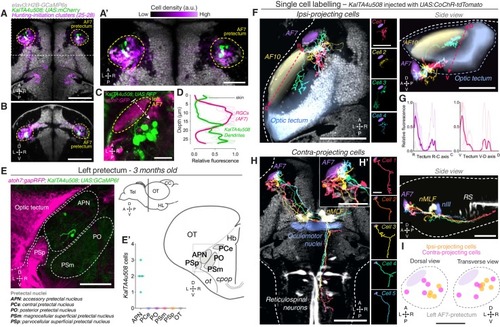
AF7-pretectal neurons with distinct projection patterns labelled by KalTA4u508. (A) Dorsal view of KalTA4u508;UAS:mCherry expression at 6 dpf (green) registered to the elavl3:H2B-GCaMP6s reference brain (grey). Neurons of all four hunting-initiation clusters combined are shown in purple, colour-coded according to local cell density (clusters 25–28, N = 6,630 cells from eight fish). AF7-pretectum is indicated in yellow and the region is enlarged in (A’). (B) Ventro-dorsal cross-section of data in (A). (C) Left AF7-pretectum in a 6 dpf KalTA4u508;UAS:RFP;atoh7:GFP larva (dorsal view, maximum-intensity projections, 10 planes, 10 µm depth). (D) Dendritic stratification of KalTA4u508 neurons (green) relative to RGC axons (magenta) in AF7. Y-axis indicates distance from the skin in µm (dashed white arrow in C). Mean and individual stratification patterns are reported (N = 4 fish). (E) KalTA4u508 neurons in pretectum of a 3 month-old KalTA4u508;UAS:GCaMP6f;atoh7:gapRFP fish. Pretectal and tectal regions in the left hemisphere are shown. Schematic indicates location of micrograph and pretectal nuclei (transverse plane). Number of KalTA4u508 cells in each pretectal nucleus are reported in (E’) (N = 4 fish). APN, accessory pretectal nucleus; CC, cerebellar corpus; cpop, postoptic commissure; Hb, habenula; HL, hypothalamic lobe; OT, optic tectum; ot, optic tract; PCe, central pretectal nucleus; PO, posterior pretectal nucleus; PSm, magnocellular superficial pretectal nucleus, PSp, parvocellular superficial pretectal nucleus; Tel, telencephalon. (F) Tracings of individual KalTA4u508 projection neurons that innervate the ipsilateral tectum (‘ipsi-projecting’ cells, N = 4 cells from four fish). Data is from 6 to 7 dpf larvae and is registered to the elavl3:H2B-GCaMP6s reference brain (grey). Selected anatomical regions from the ZBB brain atlas are overlaid. To enable morphological comparisons, all traced neurons are shown in the left hemisphere. (G) Fluorescence profiles of neurites of ipsi-projecting KalTA4u508 cells along the rostro-caudal (R-C, left) and ventral-dorsal (V-D, right) axes of the optic tectum (dashed red arrows in F). Mean and individual profiles are reported (N = 4 cells). (H) Tracings of KalTA4u508projection neurons innervating the contralateral hindbrain (‘contra-projecting’ cells, N = 5 cells from five fish). Dendritic arbours adjacent to AF7 are enlarged in inset (H’). nMLF, nucleus of the medial longitudinal fasciculus; RS, reticulospinal system. (I) Soma location of ipsi- and contra-projecting KalTA4u508 cells in AF7-pretectum. Scale bars, 100 µm, except (A’), (H’), (I), 50 µm, and (C), 20 µm. A, anterior; C, caudal; D, dorsal; L, left; P, posterior; R, right (rostral in G); V, ventral. See also Figure 3—figure supplement 1. |
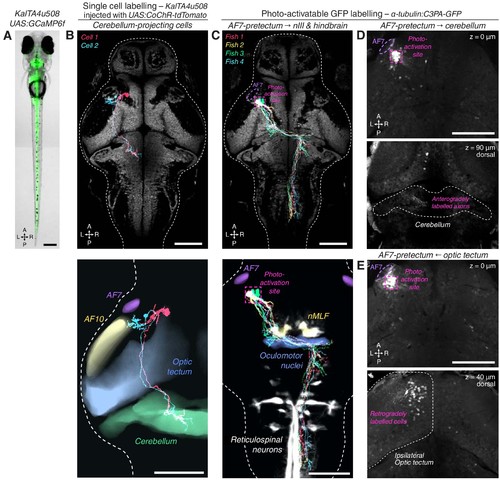
KalTA4u508 neurons innervating cerebellum, and PA-GFP projection mapping from AF7-pretectum.(A) Expression pattern of the KalTA4u508 transgene, illustrated by a KalTA4u508;UAS:GCaMP6ftransgenic larva (6 dpf). (B) Tracings of KalTA4u508 neurons projecting to ipsilateral medial corpus cerebellum (N = 2 cells from two fish). The bottom image shows tracings overlaid with selected anatomical regions from the ZBB brain atlas. (C) Tracings of PA-GFP-labelled AF7-pretectal cells projecting to oculomotor nuclei and contralateral hindbrain in 7 dpf α-tubulin:C3PA-GFP larvae (N = 4 fish) registered to the elavl3:H2B-GCaMP6s reference brain (grey). The photo-activation site is indicated in magenta. (D) PA-GFP-labelled AF7-pretectal cells in a 7 dpf α-tubulin:C3PA-GFP larva. The photo-activation site is indicated in magenta. Anterogradely labelled axonal terminals are visible in the ipsilateral medial cerebellum (bottom image, z-plane location is relative to top z-plane). (E) A second example of photoactivation that retrogradely labelled cell bodies in the ipsilateral anterior-ventral optic tectum. Scale bars, 100 µm except (A), 200 µm. A, anterior; L, left; P, posterior; R, right. |

Optogenetic stimulation of single KalTA4u508 pretectal neurons induces hunting.(A) Optogenetic stimulation of single neurons paired with behavioural tracking. (B) A single KalTA4u508 neuron in a 7 dpf KalTA4u508;elavl3:H2B-GcaMP6s larva that was injected at the one-cell stage with UAS:CoChR-tdTomato DNA. This ‘contra-projecting’ neuron is ‘Cell 3’ in Figure 3H. A, anterior; L, left; P, posterior; R, right. Scale bar, 100 µm. (C) Example frames from an optogenetically induced hunting event. Labels indicate time relative to saccadic eye convergence/hunting initiation. (D) Tail angle (grey) and ocular vergence angle (red) during an optogenetically induced hunting event (‘ipsi-projecting’ cell located in the left AF7-pretectum; this neuron is ‘Cell 4’ in Figure 3F; see also Video 2). Asterisk indicates time of convergent saccade. (E) Larval location colour-coded by vergence angle during the example hunting event in (D). (F) Hunting response probability for LED-On versus non-stimulation trials for larvae that performed at least one eye convergence during optogenetic stimulation (N = 23 fish). (G) Morphological identity of KalTA4u508 neurons that elicited hunting upon optogenetic stimulation. Numbers of responsive larvae are reported at the bottom (N = 23 fish). (H) Hunting response probability upon optogenetic stimulation of ipsi-projecting (orange, N = 9 cells) and contra-projecting neurons (magenta, N = 14). (I–P) Comparison of behavioural kinematics between optogenetically induced hunting events (blue, N = 23 fish) and Paramecia hunting (dark grey, N = 31). Tail kinematics for non-hunting swim bouts were recorded from the same larvae that were monitored during Paramecia hunting (light grey). In (L–P), data from all bouts are plotted, whereas in (I–K) the median or mean for each larva is reported. (Q–S) Behavioural kinematics of hunting events induced by stimulation of ipsi-projecting KalTA4u508 neurons (orange, N = 9 cells) or contra-projecting neurons (magenta, N = 14). (T) VMVs and cluster identities of KalTA4u508 neurons that induced hunting upon optogenetic stimulation and subsequently underwent calcium imaging (N = 6 cells from six fish). Symbols on the left indicate projection cell class and left/right location. HIx scores are shown on right. See also Figure 5—figure supplements 1,2 and Video 2. |
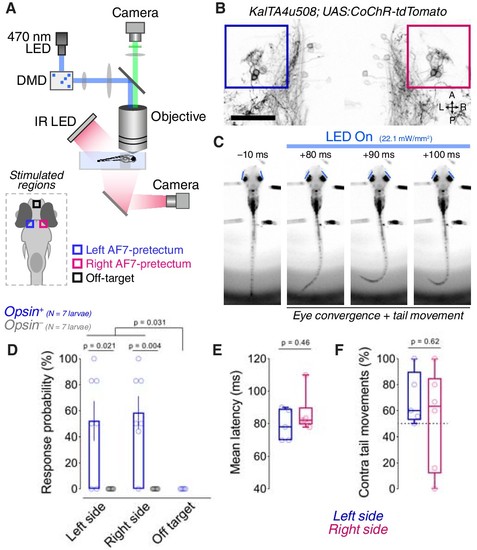
Optogenetic stimulation of the KalTA4u508 pretectal population induces hunting with short latency.(A) Digital micromirror device (DMD) setup used for patterned illumination of pretectum and behavioural tracking in partially tethered larvae. (B) Opsin expression in a 6 dpf KalTA4u508;UAS:CoChR-tdTomato larva (image acquired with 2-photon microscope). Coloured boxes indicate AF7-pretectal regions targeted for stimulation. A, anterior; L, left; P, posterior; R, right. Scale bar, 50 µm. (C) Frames from an optogenetically induced hunting event in a tethered 7 dpf KalTA4u508;UAS:CoChR-tdTomato larva. Times relative to light onset. Eye position is marked by blue lines. (D) Hunting response probability of opsin-expressing (blue) and control, opsin-negative (grey), larvae (mean ± SEM, N = 7 fish per group). Between 6 and 9 trials per stimulated region were performed in each animal. (E) Mean latency of hunting responses for left (blue) and right (red) pretectal stimulations. (F) Percentage of hunting responses in which the first tail movement was contralaterally directed. |
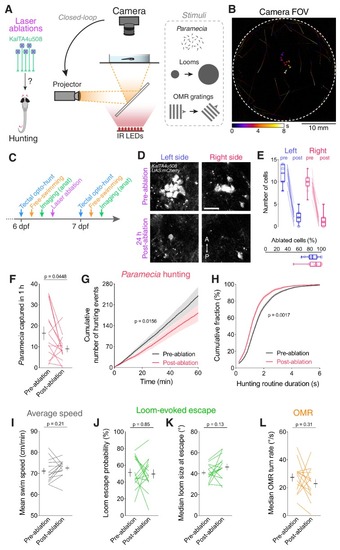
Ablation of KalTA4u508 pretectal neurons impairs hunting.(A) Laser ablation of KalTA4u508 pretectal neurons and assessment of visuomotor behaviours. (B) Time-projection of larval behaviour (duration 8 s) showing trajectories of Paramecia and larval zebrafish swimming in the arena. (C) Time course of behavioural tests, ablation and brain imaging. (D) Pretectal neurons before (top, 6 dpf) and 24 hr after (bottom, 7 dpf) bilateral laser-ablations in a KalTA4u508;UAS:mCherry;elavl3:itTA;Ptet:ChR2-YFP larva. Images show maximum-intensity projections (red channel, 10 planes, 10 µm depth). A, anterior; P, posterior. Scale bar, 20 µm. (E) Quantification of cell ablation in left (blue) and right (red) AF7-pretectum (N = 14 fish). (F–H) Assessment of hunting performance before and after bilateral ablation of KalTA4u508 neurons (N = 14 fish). Mean ± SEM is reported for each condition. (I–L) Average swim speed, loom-evoked escape and OMR behaviour, before and after ablations. See also Figure 6—figure supplement 1. |

Assessment of visuomotor behaviours in control larvae.(A) RGC axonal arborisations in AF7 (magenta) before (top, 6 dpf) and 24 hr after (bottom, 7 dpf) bilateral laser-ablation of KalTA4u508 pretectal neurons (green) in a KalTA4u508;UAS:mCherry;atoh7:GFP larva. (B) Sham ablations. Thalamic neurons before (top, 6 dpf) and 24 hr after (bottom, 7 dpf) bilateral laser-ablations in a atoh7:GFP;gata2a:GFP larva. Images show maximum-intensity projections (20 µm depth). Targeted cells are outlined in yellow. (C) Mean number of cells labelled in the thalamus per hemisphere before and after ablations (N = 10 fish). (D) Mean number of ablated thalamic cells per hemisphere. (E) Paramecia consumption in atoh7:GFP;gata2a:GFP larvae, before and after thalamic ablations (N = 10 fish). Black symbols show mean ± SEM across animals. (F–H) Non-ablated control. Assessment of Paramecia hunting in KalTA4u508;UAS:mCherry;elavl3:itTA;Ptet:ChR2-YFP control larvae at 6 and 7 dpf (N = 16 fish). (I–L) Average swim speed, loom-evoked escape and OMR, in control larvae. (M) Hunting response probability upon optogenetic stimulation of avOT in non-ablated control larvae. Scale bars, 50 µm, except in (A), 20 µm. A, anterior; L, left; P, posterior; R, right. |

Optogenetic stimulation of avOT induces hunting in the absence of RGCs.(A) Optogenetic stimulation of anterior-ventral optic tectum (avOT). (B–C) Dorsal view of ChR2-YFP expression in sighted (B) and blind atoh7-/- (C) 6 dpf elavl3:itTA;Ptet:ChR2-YFP;atoh7:gapRFPlarvae registered to the ZBB brain atlas. Axonal projections of RGCs labelled by the atoh7:gapRFP transgene are displayed in magenta and are absent in atoh7-/- larvae. Images derive from median datasets across multiple immunostained brains (N = 6 sibling and N = 7 blind fish) and show maximum-intensity projections through focal planes encompassing AF7-pretectal regions. (D) ChR2 expression relative to KalTA4u508 neurons in a 6 dpf KalTA4u508;UAS:mCherry;elavl3:itTA;Ptet:ChR2-YFP larva. Images are single focal planes obtained from the left AF7-pretectum (plane one is dorsal relative to the other z-planes). KalTA4u508 neurons are not labelled with ChR2-YFP. (E) Time sequence composite image showing selected frames from an example optogenetically induced hunting sequence in a blind atoh7-/- 6 dpf elavl3:itTA;Ptet:ChR2-YFP;atoh7:gapRFP larva (see also Video 3). (F) Vergence angle overlaid onto larval location during the optogenetically induced hunting sequence from (E). Asterisks indicate time of convergent saccades. (G) Tail angle (grey) and ocular vergence angle (red) during the optogenetically induced hunting sequence shown in (E) and (F). Asterisks indicate time of convergent saccades. (H) Fraction of larvae that performed eye convergences during optogenetic stimulations. Larvae were either sighted (atoh7+/+ or atoh7+/-) or blind (atoh7-/-) and either opsin-positive (elavl3:itTA;Ptet:ChR2-YFP;atoh7:gapRFP) or opsin-negative (atoh7:gapRFP). Numbers of responsive larvae are reported above bars. (I) Response probability of larvae that performed eye convergence in at least one optogenetic stimulation trial. (J–L) Behavioural kinematics for optogenetically induced hunting events elicited in sighted (blue, N = 13 fish) and blind atoh7-/- (pink, N = 29) elavl3:itTA;Ptet:ChR2-YFP;atoh7:gapRFPlarvae. Scale bars, 100 µm, except in (D), 30 µm. A, anterior; L, left; P, posterior; R, right. See also Figure 7—figure supplement 1 and Video 3. |