
- Title
-
Mechanically activated Piezo channels modulate outflow tract valve development through the Yap1 and Klf2-Notch signaling axis
- Authors
- Duchemin, A.L., Vignes, H., Vermot, J.
- Source
- Full text @ Elife
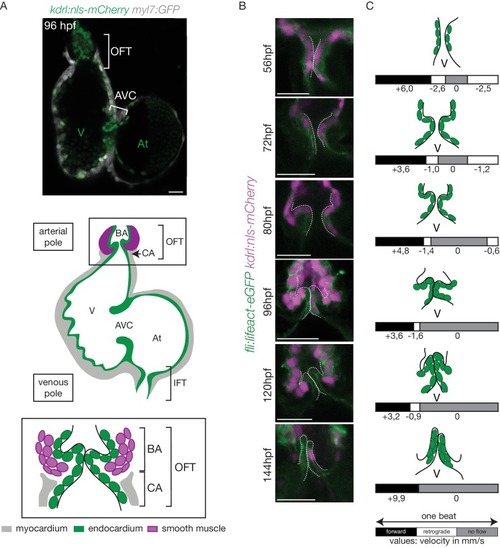
The OFT develops from 56 hpf to form functional valves at 144 hpf. (A) Top: Z-section of the double transgenic line Tg(kdrl:nls-mCherry; myl7:GFP) showing the overall structure of the heart. Bottom: Scheme of the zebrafish heart with the endocardium, myocardium and smooth muscles and zoom on the OFT structure. The OFT includes the CA and the BA. The CA is the zone of the myocardial connection of the ventricle to the BA. The BA is after the ventricle and is surrounded by smooth muscles. Scheme adapted from Felker et al. (2018). OFT: outflow tract, IFT: inflow tract, AVC: atrioventricular canal, At: atrium, V: ventricle, BA: bulbus arteriosus, CA: conus arteriosus. Scale bar: 20 µm. (B) Z-sections of the double transgenic line Tg(fli:lifeact-EGFP; kdrl:nls-mCherry) at different time-points showing the endocardial OFT structure. Scale bar: 25 µm. (C) Schematic representation summarizing the formation of the valve leaflets over time and flow profile in the OFT during development (from 56 hpf to 144 hpf) showing the forward flow (black), retrograde flow (white) and no flow (grey) fractions with the velocity of the red blood cells (in mm/s) using the double transgenic line Tg(gata1:ds-red; kdrl:EGFP). V: ventricle. |
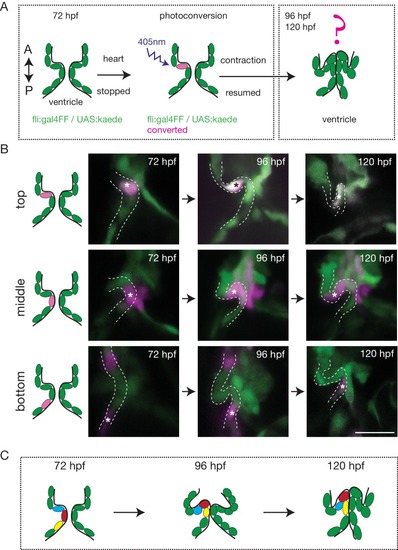
The endothelium contribution to emerging OFT valve leaflets. (A) Experimental set-up for the photoconversion studies. Heart was stopped at 72 hpf, the region of interest exposed to 405 nm light to convert kaede from green to red (shown in magenta) fluorescent form and heart contraction was resumed until 120 hpf. Beating hearts were imaged at 96 hpf and 120 hpf by spinning disk microscopy. A. Anterior, P. Posterior. (B) Z-sections of the Tg(fli:gal4FF; UAS:Kaede) line just after photoconversion (72 hpf), and at 96 hpf and 120 hpf. The star highlights the photoconverted cell in the top (n = 6), middle (n = 5) and bottom (n = 4) part of the OFT valve. The other photoconverted cell anteriorly goes out of the frame. Scale bar: 20 µm. Results obtained from three independent experiments. (C) Schematic representation of the results of the photoconversion studies showing the folding of the endothelium in the OFT. EXPRESSION / LABELING:
|

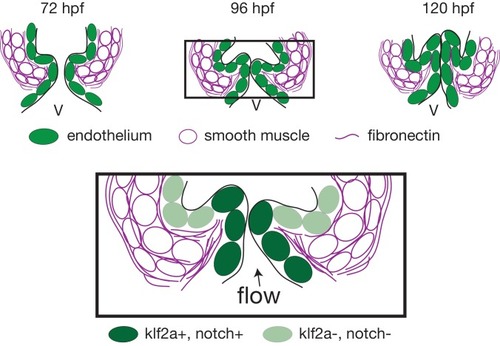
The OFT endothelium is surrounded by smooth muscle cell progenitors expressing fibronectin and elastin. (A) Staining of Fibronectin1 (magenta) on Tg(myl7:GFP; fli1a:nls-mCherry), highlighting the myocardium (white) and the endothelium (green) at 72 hpf. Scale bar: 20 μm. V: ventricle. Fibronectin1 (anti-Fn1, magenta) counterstaining on Tg(kdrl:GFP) and Elastinb (anti-Elnb, magenta) counterstaining on Tg(fli:lifeact-EGFP) showing their expressions in the OFT at 72 hpf (B), (B’) respectively) at 96 hpf (C), (C’) respectively) and at 120 hpf (D, D’ respectively). Scale bar: 20 µm. Arrows show the Fn1 localisation within the valve leaflets. Results obtained from three independent experiments. (E) Scheme of the three layers shown in A’, B, C and D (magenta, smooth muscles; green, endothelium; grey, myocardium; Fibronectin1, magenta lines) at 72hpf, 96hpf and 120hpf. EXPRESSION / LABELING:
|

Klf2a and Notch reporters are activated in the OFT endothelium Confocal z-section of the Tg(klf2a:H2B-GFP; fli:nls-mCherry). (A) and Tg(tp1:dGFP) (B) at 72hpf. OFT: outflow tract, At: atrium, V: ventricle. Scale bar: 20 µm. (C) Confocal z-section of OFT valves expressing the Klf2a reporter and Notch reporter at 72 hpf, 96 hpf, and 120 hpf. Schemes explaining the considered anterior (grey) and posterior (green) parts of the valve at 72 hpf, 96 hpf, and 120 hpf. A: anterior, P: posterior. V: ventricle. Scale bar: 10 µm. (D) Quantification of the fluorescent intensity of the Klf2a (GFP over mCherry) and Notch (GFP over background) reporters in the anterior versus posterior part of the valves at 72 hpf (n = 6 embryos, p=0001 and n = 5 embryos, p=0,02 respectively), 96 hpf (n = 5 embryos, p=0005 and n = 6 embryos, p=0,0007 respectively) and 120 hpf (n = 6 embryos, p=0,01 and n = 5 embryos, p=0,01) in wild-type embryos using the student’s t-test. Boxplots: Center lines show the medians; box limits indicate the 25th and 75th percentiles as determined by R software; whiskers extend 1.5 times the interquartile range from the 25th and 75th percentiles, outliers are represented by dots. Results obtained from three independent experiments. EXPRESSION / LABELING:
|

Hippo pathway effector Yap1 is active and Yap1 is essential for valve formation in the OFT. (A) Confocal z-sections of the double transgenic line 4xGTIIC:d2GFP; kdrl:membrane-mCherry counterstained with the Elnb antibody and focused on the OFT. Scale bar: 20 µm. (B) Example of the valve phenotypes (normal, thick, delayed and no valve) and quantification of the phenotypes in the yap1+/+ controls embryos, yap1+/- and in yap1-/- mutant embryos. Chi-square test. n.s.: non significant, ***: p<10−3. Scale bar: 10 µm. Results obtained from two independent experiments. EXPRESSION / LABELING:
PHENOTYPE:
|

Klf2a and notch response, as well as the smooth muscle cell identity, are flow-dependent. Quantification of the Klf2a and Notch reporter expressions in tnnt2a-morpholino injected embryos showing a ‘beating heart’ (p=0,27 and p=0,01 respectively). (A) and a ‘slow beating heart’ (p=0,7 and p=0,1 respectively) (B) at 72 hpf. N = 2 independent experiments. (C) Quantification of the phenotypes in the control (n = 24), vlad tepes mutant (n = 21 embryos from two independent experiments), tnnt2aMO-injected embryos (n = 9 embryos from two independent experiments). Chi-square test. **: p<10−2, ******: p<10−6. (D) Z-sections of the Tg(fli:lifeact-eGFP) counterstained with either Fibronectin1 (Fn1), elastin (Elnb) or Yap1 in tnnt2a-morpholino injected embryos (slow beating and beating heart). Scale bar: 20 µm. N = 2 independent experiments. (E) Z-section and quantification of the BA diameter and DAF-FMDA intensity in tnnt2a-morpholino injected embryos (p=0,0005 and p=0,05 respectively). Student’s t-test. Boxplots: Center lines show the medians; box limits indicate the 25th and 75th percentiles as determined by R software; whiskers extend 1.5 times the interquartile range from the 25th and 75th percentiles, outliers are represented by dots. (F) Scheme summarizing the down-regulation of the smooth muscle markers in ‘slow beating heart’ embryos compared to ‘beating heart' embryos. EXPRESSION / LABELING:
PHENOTYPE:
|
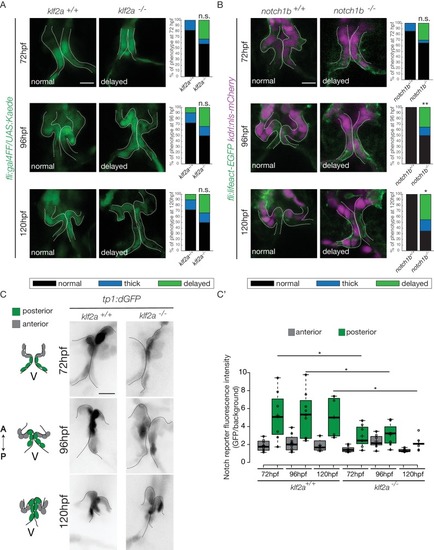
Klf2a and notch are necessary for valve formation. Quantification of the valve phenotypes at 72 hpf, 96 hpf and 120 hpf (normal, thick, delayed) in klf2a+/+(n = 11), and klf2a-/- (n = 12) using the Tg(fli:gal4FF/UAS:Kaede). (A) and notch1b+/+ (n = 7) and notch1b-/- (n = 20) using Tg(fli:lifeact-EGFP; kdrl:nls-mCherry) embryos. (B) Scale bar: 10 µm. N = 3 independent experiments. (C) Confocal z-sections of the Tg(tp1:dGFP) in klf2a+/+ and klf2a-/- embryos at 72 hpf, 96 hpf and 120 hpf. V: ventricle. Scale bar: 10 µm. (C’) Quantification of the fluorescent intensity of the Notch reporter (GFP over background) in the anterior versus posterior parts of the valves in in klf2a+/+ (n = 5) and klf2a-/- (n = 4) embryos. Statistical test were performed to compare the posterior intensities in klf2a+/+versus klf2a-/- at 72 hpf (p=0,05), 96 hpf (p=0,03) and 120 hpf (p=0,04). Student’s t-test. Boxplot: Center lines show the medians; box limits indicate the 25th and 75th percentiles as determined by R software; whiskers extend 1.5 times the interquartile range from the 25th and 75th percentiles, outliers are represented by dots. Results obtained from three independent experiments. EXPRESSION / LABELING:
PHENOTYPE:
|
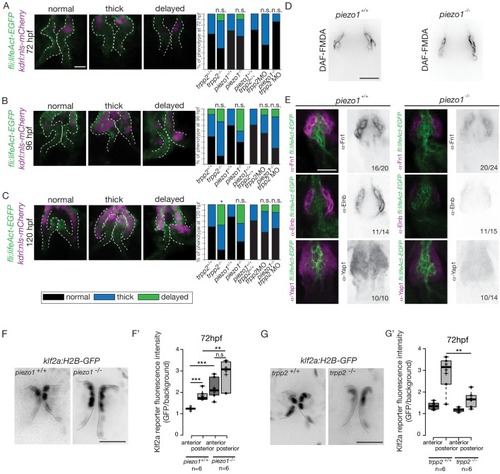
Flow and mechanosensitive channels are necessary for proper OFT valve formation. (A) Z-sections and quantifications of the valves phenotypes (normal, thick, delayed) of the Tg(fli:lifeaAct-EGFP; kdrl:nls-mCherry) at 72 hpf (B), 96 hpf (C) and 120 hpf (D) in trpp2+/+(n = 11, n = 10, n = 10), trpp2-/- (n = 8, n = 13, n = 13 from three independent experiments), piezo1+/+ (n = 10, n = 10, n = 9), piezo1-/-(n = 10, n = 10, n = 9 from two independent experiments), piezo1+/+; trpp2+/+ (n = 7), trpp2-morpholino injected embryos (n = 9) and piezo1-/-; trpp2-morpholino injected embryos (n = 7). Scale bar: 10 µm. (D) Z-section of the OFT stained with DAF-FMDA in piezo1+/+ and piezo1-/-. Scale bar: 20 µm. (E) Fibronectin1 (Fn1), elastin (Elnb) and Yap1 staining on Tg(fli:lifeact-eGFP) in piezo1+/+ (n = 12, n = 4 and n = 10 respectively) and piezo1-/- (n = 12, n = 4 and n = 10 respectively from three independent experiments). Scale bar: 20 µm. Z-sections (F) and quantification (F’) of the klf2a reporter (GFP over background) in the anterior and posterior parts of the valves in piezo1+/+ (n = 6) and piezo1-/- (n = 6) obtained from two independent experiments). Scale bar: 20 µm. Z-sections (G) and quantification (G’) of the klf2a reporter (GFP over background) in the anterior and posterior parts of the valves in trpp2+/+ (n = 6) and trpp2-/- (n = 6) (obtained from two independent experiments). Scale bar: 20 µm. Student’s t-test. Boxplot: Center lines show the medians; box limits indicate the 25th and 75th percentiles as determined by R software; whiskers extend 1.5 times the interquartile range from the 25th and 75th percentiles, outliers are represented by dots. EXPRESSION / LABELING:
PHENOTYPE:
|
Working model summarizing OFT valve morphogenesis in response to mechanical forces. Two cell layers forming the OFT respond to piezo1 activity: the endothelium (green) and smooth muscle cells (magenta). Endothelial klf2a expression is repressed by Piezo1. In the smooth muscle cells, the expression of elastin (Elnb), fibronectin (Fn1) and Yap1 is modulated by Piezo1. Fibronectin is localized in the smooth muscle cell layer and within the forming valve (magenta lines). Future work will help to decipher how the two cell layers interact with each other to modulate OFT valve formation. V, ventricle. |