Axons accumulate synaptic vesicle release machinery under myelin sheaths. a Schematic of transgenes used to assess synaptic puncta density along myelinated and bare regions of axons. b Representative image of Syp-eGFP in a myelinated phox2b + axon in a living 3 dpf Tg(phox2b:GAL4; UAS:syp-eGFP; sox10:mRFP) larva. Bracketed dashed lines indicate two myelin sheaths (rectangles) on the axon. b′ Same as (b) for Vamp2-eGFP; animal genotype is Tg(phox2b:GAL4; sox10:mRFP) with transient expression of UAS:Vamp2-eGFP. c Representative images of Syp-eGFP distribution in myelinated phox2b + axons at 3, 4, and 5 dpf. d Comparisons of Syp-eGFP puncta density within bare vs myelinated regions of axons at each timepoint. n = 7 bare regions/98 puncta and 7 sheaths/18 puncta (3 dpf); 8 bare/119 puncta and 11 sheaths/43 puncta (4 dpf); 9 bare/75 puncta, and 12 sheaths/38 puncta (5 dpf). Wilcox rank-sum test, p = 0.13, p = 0.002, p = 0.00025 for 3, 4, and 5 dpf, respectively. Scale bars, 10 µm

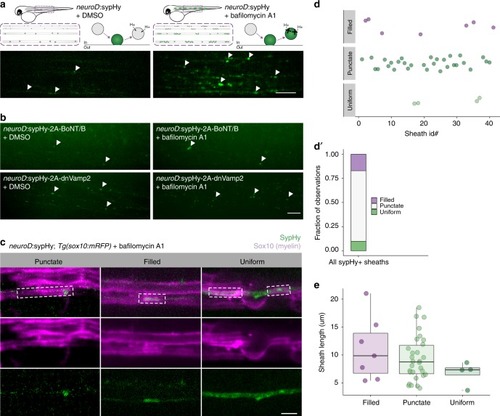
Variable synaptic vesicle exocytosis sites under myelin sheaths. a Left, schematic of Syp-pHluorin (SypHy) function and transient expression in spinal cord neurons and representative max-projection image of a live 4 dpf larva expressing neuroD:sypHy. Arrowheads indicate dim spots of SypHy signal. Right, similar but in the presence of bafilomycin A1 to inhibit vesicle reacidification. Note appearance of several large SypHy + “hotspots” along axons. Scale bar, 10 µm. b Similar to a except larvae are co-expressing inhibitors of exocytosis, botulinum toxin (BoNT/B) or dominant-negative Vamp2 (dnVamp2). Both BoNT/B and dnVamp2 suppress bafilomycin induction of SypHy hotspots. Arrowheads indicate a few visible SypHy spots. Scale bar, 10 µm. c Expression of neuroD:sypHy in Tg(sox10:mRFP) larvae treated with bafilomycin reveals three types of SypHy-reported exocytosis sites under myelin sheaths: punctate, filled, and uniform. Boxes outline individual myelin sheaths. Scale bar, 5 µm. d Classification plot of SypHy signal under 41 sheaths (from n = 20 larvae) by category. Presented as a bar in d′ for visible contribution of each category to the total. e No association between category and sheath length, Kruskal–Wallis test

PSD95 is expressed by myelinating oligodendrocytes and is variably localized within myelin sheaths. a CRISPR/Cas9-mediated GAL4 enhancer trap of dlg4b reports spinal cord cells that express dlg4b via UAS:eGFP-CAAX expression. Larvae additionally carrying the mbpa:tagRFP transgene reveal mbp+ myelinating oligodendrocytes. Closed arrowheads indicate mbp+, dlg4b+ oligodendrocytes and open arrowheads indicate mbp-, dlg4b+ cells. Scale bar, 10 µm. b, b′, b″) PSD95 localization within oligodendrocytes detected by expression of exogenous PSD95-GFP fusion protein (b), expression of PSD95.FingR to detect endogenous PSD95 localization (b′), and expression of PSD95.FingR to detect endogenous PSD95 localization with a transcriptional repression system to limit unbound PSD95.FingR-GFP (b″). Arrowheads indicate puncta, scale bar 10 µm. c Expression of the transcriptionally-regulated system (b″) with Tg(sox10:mRFP) to label myelin shows that not all sheaths display localized PSD95 puncta (“diffuse”), and among those that do, labeling is either restricted to the sheath end (“end”), or periodic along the length of the sheath (“periodic”). Scale bar, 2 µm. d Classification plot of sheath labeling patterns (y-axis) for individual cells (x-axis) at 3, 4, and 5 dpf. n = 6 cells/29 sheaths (3 dpf); 5 cells/33 sheaths (4 dpf); 7 cells/32 sheaths (5 dpf). For each age group, dots of the same color denote sheaths belonging to the same cell. Note that most cells formed sheaths with different labeling patterns. Over developmental time, the distribution of labeling patterns changes as assessed by Chi square test (e), notably with a reduction of diffuse labeled sheaths, but all three categories persist at 5 dpf. (f) Later in development (8 dpf), PSD95.FingR-GFP is less punctate overall but remains enriched at the ends of sheaths (arrowheads). g Sagittal section of a 5 dpf Tg(mbpa:eGFP-CAAX) larva spinal cord fixed and immunolabeled with anti-PSD95. Right panels show higher magnification of the boxed region. Arrowheads indicate PSD95 signal colocalized with sheaths; open arrowhead marks a sheath without PSD95 at the terminal end. h Similar to g but with transient expression of neuroD:sypb-mScarlet to sparsely label synaptic vesicle puncta. Inset shows colocalized PSD95 and Syp-mScarlet within a sheath. Scale bars are 10 µm and 2 µm (insets)

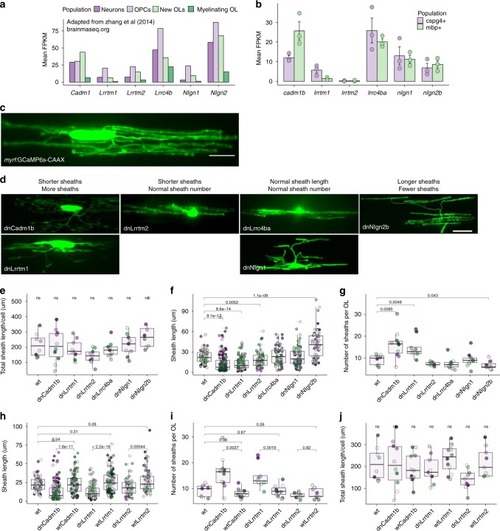
Candidate synaptogenic adhesion molecules have variable effects on myelin sheath length and number. a RNA-seq FPKM values for mouse cortical neurons, OPCs, new oligodendrocytes, and myelinating oligodendrocytes for candidates Cadm1, Lrrtm1, Lrrtm2, Lrrc4b, Nlgn1, and Nlgn2. Plot generated using publicly available values from brainrnaseq.org14. b RNA-seq FPKM values for FAC-sorted zebrafish olig2 + /cspg4 + (cspg4 + ) and mbpa + /olig2 + (mbp + ) cells for zebrafish homologs of the same candidates36. c Oligodendrocyte transiently expressing myrf:GCaMP6s-CAAX. Scale bar 10 µm. d Candidate dominant-negative (dn) alleles expressed transiently as myrf:dnX-2A-GCaMP6s-CAAX and grouped by effect on sheath length and number. Scale bar 10 µm. e Total sheath length per cell expressing each dominant-negative candidate was unchanged by all candidates, Kruskal–Wallis test. Dot color marks individual cells and matches colored dots in corresponding sheath length and number plots. f Sheath length values for each dominant-negative candidate. n (cells/sheaths) = 8/74 wt, 10/159 dnCadm1b, 9/132 dnLrrtm1, 9/67 dnLrrtm2, 9/68 dnLrrc4ba, 9/83 dnNlgn1, 8/55 dnNlgn2b. Data in plots fi were tested by Wilcox rank-sum with Bonferroni-Holm correction for multiple comparisons. dnLrrc4ba/wt and dnNlgn1/wt comparisons were ns. g Sheath number values for each dominant-negative candidate (n listed in f). h Decreased sheath length in dnCadm1b, dnLrrtm1, and dnLrrtm2 cells is specific to the DN disruption, because expression of the full-length (wt) protein does not reduce sheath length. n(cells/sheaths) = 11/91 wtCadm1b, 12/108 wtLrrtm1, 9/72 wtLrrtm2. i Expression of WT forms of the three candidates that reduced sheath length resulted in normal sheath number. j Total sheath length per cell expressing each WT candidate was not significantly different for any group, Kruskal–Wallis test

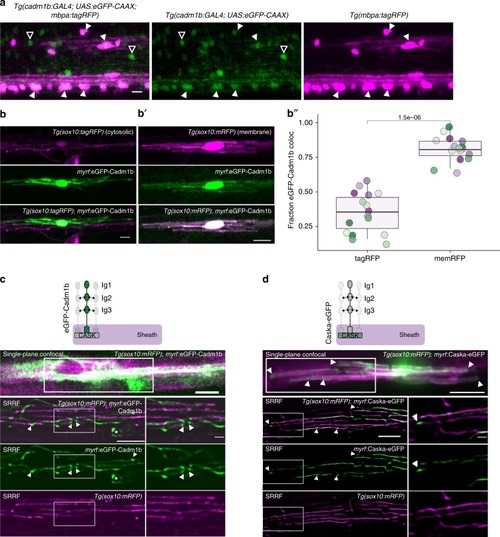
Cadm1b localizes to myelin sheath membrane. a CRISPR/Cas9-mediated GAL4 enhancer trap of cadm1b reports cells expressing cadm1b via UAS:eGFP-CAAX expression. Larvae additionally carrying Tg(mbpa:tagRFP) reveal mbp + myelinating oligodendrocytes. Closed arrowheads indicate mbp + , cadm1b + oligodendrocytes, whereas open arrowheads indicate mbp-, cadm1b + cells (likely neurons). Scale bar, 10 µm. b, b′) Expression of myrf:eGFP-Cadm1b in Tg(sox10:tagRFP) (b) or Tg(sox10:mRFP) (c) co-labeled oligodendrocytes. b′′ Fraction of eGFP-Cadm1b colocalized with RFP (Mander’s colocalization coefficient) for Tg(sox10:tagRFP) (tagRFP) and Tg(sox10:mRFP) (memRFP). n = 16 cells (tagRFP), 16 cells (memRFP), Wilcox rank-sum test. Colored dots represent individual cells. c Confocal single-plane (top) and super resolution radial fluctuations (SRRF) (bottom 3 panels) imaging of a eGFP-Cadm1b expressing oligodendrocyte in a Tg(sox10:mRFP) larva. Arrowheads indicate eGFP-Cadm1b puncta that are not present in mRFP SRRF. Asterisk marks a sheath going in to the plane of view with circular edges surrounded by eGFP-Cadm1b puncta. Scale bars 5 µm except for innermost inset, 1 µm. d Similar to c for an oligodendrocyte expressing Caska-eGFP. Scale bars 10 µm (top), 5 µm (left SRRF), 1 µm (SRRF insets)

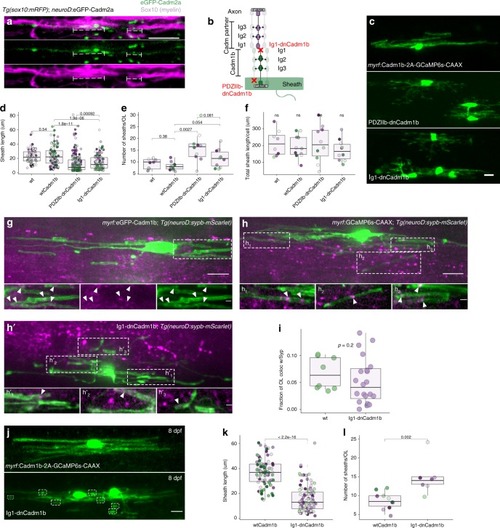
The extracellular, trans-acting adhesion domain (Ig1) of Cadm1b promotes myelin sheath growth. a Neuronal eGFP-Cadm2a puncta (green) localize under myelin sheaths (magenta, brackets). Scale bar, 10 µm. b Schematic of dominant-negative oligodendrocyte Cadm1b variants, PDZIIb-dnCadm1b and Ig1-dnCadm1b, interacting with partner Cadm located on neurons. c Representative examples of oligodendrocytes expressing wildtype Cadm1b, PDZIIb-dnCadm1b, and Ig1-dnCadm1b with GCaMP6s-CAAX to label sheath membrane. Scale bar, 10 µm. d Sheath lengths for wt, wtCadm1b-, PDZIIb-dnCadm1b-, and Ig1-dnCadm1b-expressing oligodendrocytes. Note that PDZIIb-dnCadm1b is the same allele presented in Fig. 4. n (cells/sheaths) = 8/74 (wt), 11/91 (wtCadm1b), 10/159 (PDZIIb-dnCadm1b), 10/115 (Ig1-dnCadm1b), Wilcox rank-sum test with Bonferroni-Holm correction for multiple comparisons. Dots of the same color indicate sheaths belonging to the same cell and match those in plots e and f. e Sheath number for wt, wtCadm1b-, PDZIIb-dnCadm1b-, and Ig1-dnCadm1b-expressing oligodendrocytes. Same n and statistical test as in d. f Total sheath length generated per cell is unchanged by all alleles, Kruskal–Wallis test. (g, h, h′) Max projection image of myrf:eGFP-Cadm1b oligodendrocyte in Tg(neuroD:sypb-mScarlet) larvae, in which Syp-mScarlet is expressed pan-neuronally. Inset is a substack projection of 6 slices (0.31 µm/slice) containing eGFP-Cadm1b-labeled sheaths wrapping Syp-mScarlet puncta. Arrowheads indicate colocalized oligodendrocyte eGFP-Cadm1b and neuronal Syp-mScarlet signal. h, hmyrf:GCaMP6s-CAAX (wt) (h) or Ig1-dnCadm1b (h′) oligodendrocytes in Tg(neuroD:sypb-mScarlet) larvae. Insets are substack projections of 2–8 slices containing sheaths wrapping Syp-mScarlet puncta. In g, h, h′ scale bars are 10 µm/2 µm in insets. i Mander’s colocalization coefficient displaying the fraction of GCaMP6s-CAAX oligodendrocyte signal that is positive for Syp-mScarlet signal in wt and Ig1-dnCadm1b cells in 4 dpf larvae. n = 8 cells (wt) and n = 20 cells (Ig1-dnCadm1b), Wilcox rank-sum test. j, k, l By 8 dpf, Ig1-dnCadm1b-expressing oligodendrocytes still exhibit numerous stunted myelin sheaths (boxes) compared to wildtype Cadm1b-expressing cells. Sheath length (k) and number (l) for n (cells/sheaths) at 8 dpf = 10/87 (wtCadm1b) and 7/104 (Ig1-dnCadm1b), Wilcox rank-sum test. Scale bar, 10 µm

Acknowledgments
This image is the copyrighted work of the attributed author or publisher, and ZFIN has permission only to display this image to its users. Additional permissions should be obtained from the applicable author or publisher of the image. Full text @ Nat. Commun.