
- Title
-
Endothelial CDS2 deficiency causes VEGFA-mediated vascular regression and tumor inhibition
- Authors
- Zhao, W., Cao, L., Ying, H., Zhang, W., Li, D., Zhu, X., Xue, W., Wu, S., Cao, M., Fu, C., Qi, H., Hao, Y., Tang, Y.C., Qin, J., Zhong, T.P., Lin, X., Yu, L., Li, X., Li, L., Wu, D., Pan, W.
- Source
- Full text @ Cell Res.
VEGFA induces vessel regression in EXPRESSION / LABELING:
PHENOTYPE:
|

Vessel regression in CDS2 endothelium-specific knockout mice. |

PI-PIPs metabolism is involved in CDS2-deficient vessel regression. PHENOTYPE:
|

PIP3 exhaustion governs VEGFA-induced regression of CDS2-deficient endothelium. Confocal images ( PHENOTYPE:
|

FOXO1 activation is required for VEGFA-induced vessel regression in mouse retina model. |
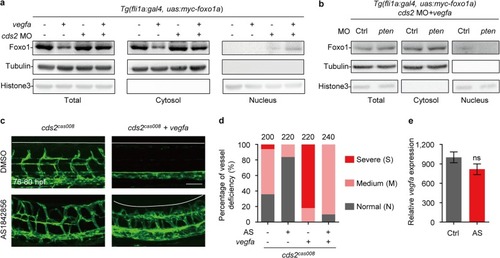
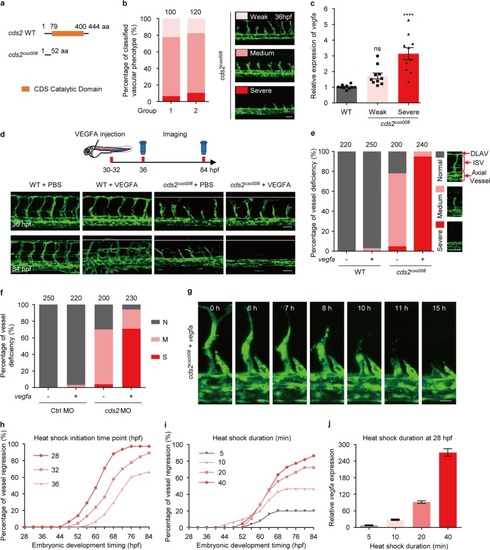
FOXO1 activation is required for VEGFA-induced regression in zebrafish PHENOTYPE:
|

PIP3 reduction is mainly caused by PLCγ mediated PIP2 hydrolysis. Representative confocal images ( PHENOTYPE:
|

ZFIN is incorporating published figure images and captions as part of an ongoing project. Figures from some publications have not yet been curated, or are not available for display because of copyright restrictions. |