
- Title
-
PCP and Wnt pathway components act in parallel during zebrafish mechanosensory hair cell orientation
- Authors
- Navajas Acedo, J., Voas, M.G., Alexander, R., Woolley, T., Unruh, J.R., Li, H., Moens, C., Piotrowski, T.
- Source
- Full text @ Nat. Commun.

Mutations in the Wnt and PCP pathways affect the hair cell alignment in the lateral line. a Confocal image of a 5 days post fertilization (dpf) Tg(cldnb: lynGFP); Tg(sqet4); Tg(cldnb:H2A-mCherry) larva. b Schematic lateral view of a 5 dpf neuromast showing the different cell types. c Diagram of a 5 dpf larva showing the two different orientations of primI and primII-derived hair cells. d In situ hybridization of wnt11 (wnt11f1) in primI and primII-derived 5 dpf neuromasts. e–j Phalloidin stainings show hair cell orientations in primI-derived neuromasts of wild type (e), Wnt pathway mutants (f–h) and PCP mutants (i–j; Fisher’s Exact Test p-val for vangl2 primI = 7.33 × 10⁻²³, gpc4 primII = 6.93 × 10⁻³¹, MZfzd7a/7b primII = 3.91 × 10⁻³³−21, MZscrib primII = 9.22 × 10⁻¹²). Individual hair cell orientation is depicted for for each of the conditions tested and the color code is the same as in (e–j). The Rose diagrams reflect the same as in (e–j) (WT n = 209 hair cells, MZwnt11 (wnt11f1) n = 295, gpc4 n = 214, MZfzd7a/7b n = 182, vangl2 n = 141, MZscrib n = 392). For e–p, comparisons of angle distributions with respect to wild type, Fisher’s Exact Test ***p < 0.001, N.S not significant, binomial test A-P ***p < 0.001, A-P* = p < 0.05. e”–p”. A-P anteroposterior orientation, D-V dorsoventral orientation. Scale bar in a equals 500 μm, d equals 20 μm, e equals 5 μm |
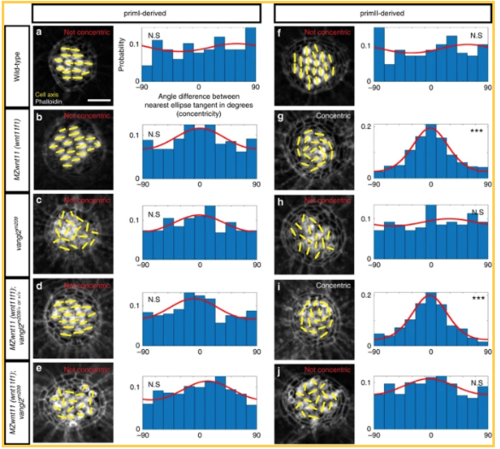
PCP and Wnt pathway mutants possess different hair cell phenotypes. In PCP mutants hair cells are randomly oriented, whereas hair cells in primII of Wnt pathway mutants show a concentric orientation pattern. a–e Phalloidin images show the cell polarity axis (yellow lines) in primI-derived neuromasts of wild type (a), Wnt pathway mutant MZwnt11 (wnt11f1) (b), PCP mutant vangl2 (c), single MZwnt11 (wnt11f1) siblings (d), and double MZwnt11 (wnt11f1);vangl2 larvae (e) homozygous mutant hair cells and their distribution of angles with respect to the nearest ellipse tangent (concentricity). Note that none of the conditions shows significant concentricity (uniform distribution p-values in a = 0.423, b = 0.054, c = 0.464, d = 0.165, e = 0.077, f = 0.019; WT n = 194 hair cells, MZwnt11 (wnt11f1) n = 353, vangl2 n = 226, MZwnt11 (wnt11f1);vangl2 sibling n = 276, MZwnt11 (wnt11f1);vangl2 doubles n = 406). The Von Mises distributions are shown in red for visual display of the data distribution. f–j Phalloidin images show the cell polarity axis (yellow lines) in primII-derived neuromasts of wild type (f), Wnt pathway mutant wnt11 (wnt11f1) (g), PCP mutant vangl2 (h), single MZwnt11 (wnt11f1) siblings (i) and double MZwnt11 (wnt11f1);vangl2 (j) homozygous mutants and their distribution of angles with respect to the nearest ellipse tangent (concentricity). Note that only the Wnt pathway mutants (g, i) show significant concentricity (Uniform distribution p-values in f = 0.314, g = 1.28 × 10⁻²⁷, h = 0.86, i = 02.92 × 10⁻¹⁹, j = 0.298; WT n = 209 hair cells, MZwnt11 (wnt11f1) n = 295, vangl2 n = 141, MZwnt11 (wnt11f1);vangl2 sibling n = 252, MZwnt11 (wnt11f1);vangl2 doubles n = 365). The von Mises distributions are shown in red for visual display of the data distribution. Yellow lines in a–j indicate the hair cell polarity axis, determined by the position of the kinocilium. Not Concentric vs Concentric labels were based on calculations in (a–j). Scale bar equals 5 μm PHENOTYPE:
|

Vangl2 asymmetry is not affected in hair cells of MZwnt11 (wnt11f1) mutants. a–d&nbs ;Double β-II-Spectrin (labeling the cuticular plates) a nd Vangl2 immunodetection in primI neuromasts of 5 dpf wild type (a), MZscrib mutants (b), scrib siblings (c) and MZwnt11 (wnt11f1) mutants (d). e– b>h Double β-II-Spectrin (labeling the cuticular plates) a nd Vangl2 immunodetection in primII neuromasts of 5 dpf wild type (e), MZscrib mutants (f), scrib siblings (g) and MZwnt11 (wnt11f1) mutants (h). i Quantification of the percentage of hair cells that show asymmetric Vangl2 for each of the conditions in both primordia-derived neuromasts. j–n Clonal localiza ion of GFP-XVangl2 in hair cells of neuromasts that show primI and primII polarity in wild type (j, k) and MZwnt11 (wnt11f1) mutants (m, n) neuromasts. The majority of the clones were localized in neuromasts in the head, which show the same hair cell orientation as in primI and primII-derived neuromasts in each of the cases. l, o Quantification of GFP-XVangl2 fluorescence around the cuticular plates (360°) of hair cells in neuromast that show primI and primII polarity of wild type (l) and MZwnt11f mutants (o). p GFP fluorescence and Phalloidin enrichment (polarity ratio, calculated from the cap of max value to the lowest value) in the different conditions analyzed in (l, o). Error bars in l, o, and p represent S.E.M. ***Fisher’s exact test p < 0.01. Scale bar sp;a equals 5 μm, j b> equals 2 μm |

Differences in the appearance of the hair cell phenotypes in vangl2 and MZwnt11 (wnt11f1) mutants. a–c Orientation of the first pair of hair cells in primII-derived neuromasts of wild type (a), MZwnt11 (wnt11f1) mutants (b), and vangl2 mutants (c) labeled with Tg(myo6b:β-Actin-GFP). In c, the left panel shows the number of correctly oriented pairs, and the right panel shows the number of incorrectly oriented pairs (the majority). The percentages for each of the conditions represent the number of pairs that show correct hair cell orientation. d–f Hair cell orientation over time in wild type (n = 3 animals) (d), MZwnt11 (wnt11f1) mutants (n = 5) (e), and vangl2 mutants (n = 2) (f) labeled with Tg(myo6b:β-Actin-GFP). Each of the conditions is depicted using a color-coded cartoon, and the hair cell orientation of the first pair is represented by arrows in the box on the lower right. To differentiate between each hair cell of the pair, each of the arrows is in a different color. g–j Hair cell orientation of the same vangl2 mutant fish at 4 dpf (g) and 5 dpf (h), and the same MZwnt11 (wnt11f1) mutant embryo at 4 dpf (i) and 5 dpf (j) in a Tg(myo6b:β-Actin-GFP) transgenic background. The distribution of angles of each given hair cell with respect to the nearest ellipse tangent (concentricity) for primII-derived neuromasts of all the conditions tested is shown. Note that only the MZwnt11 (wnt11f1) mutants at 5 dpf (j) show significant concentricity (Uniform distribution p-values in g = 0.223, h = 0.469, i = 0.308, j = 1.97 × 10−07). The von Mises distribution is shown for visual display of the data distribution. Yellow lines represent the polarity axis for each hair cell. “Not Concentric” vs. “Concentric” labels in g–j were based on the statistical significance (n = 8 neuromasts for each condition). Scale bars in a, d, and g equal 2 μm |
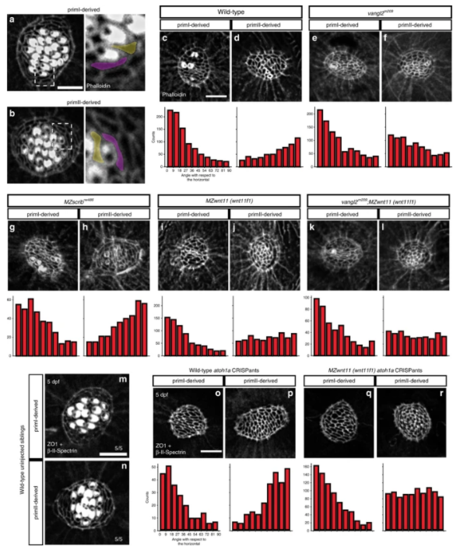
Wnt pathway genes are required for proper coordinated support cell organization. a, b Phalloidin staining of wild-type primI and primII-derived neuromasts. The dotted square outlines the area magnified in (a) and (b). Two support cells each were false colored to depict their orientation. b–j Phalloidin staining of neuromasts 3 h after hair cell ablation. c, d Wild-type primI (c) and primII-derived (d) neuromasts. e, f vangl2 mutant primI (e) and primII-derived (f) neuromasts. g, h MZscrib mutant primI (g) and primII-derived (h) neuromasts. i, j MZwnt11 (wnt11f1) mutant primI (i) and primII-derived (j) neuromasts. k, l vangl2;MZwnt11 (wnt11f1) double mutant primI (k) and primII-derived (l) neuromasts. The histograms show the distribution of binned angles of cell orientation with respect to the horizontal for each of the conditions tested. c, d Angle distribution in wild-type primI (c one-way chi square test p = 1.78 × 10−87) and primII-derived (d p = 4.54 × 10⁻¹⁹) neuromasts. Note that primI distribution is skewed toward being horizontally aligned, while the distribution in primII-derived neuromasts is toward vertical alignment. e, f Angle distribution in vangl2 mutant primI (e p = 4.91 × 10⁻¹³) and primII-derived (f p = 2.14 × 10⁻¹⁶) neuromasts. g, h Angle distribution in MZscrib mutant primI (g p = 1.40 × 10⁻¹⁴) and primII-derived (h p = 9.60 × 10⁻¹³) neuromasts. i, j Support cell orientation in MZwnt11 (wnt11f1) mutant primI (i p = 5.32 × 10−52) and primII-derived (j p = 0.006) neuromasts. k, l Support cell orientation in vangl2;MZwnt11 (wnt11f1) double mutant primI- (k p = 6.69 x 10^-26) and primII-derived (l p = 0.22) neuromasts. m, n Double β-II-Spectrin (labeling the cuticular plates) and ZO-1 staining of a 5 dpf wild-type neuromasts. o, p Wild-type atoh1a CRISPants do not possess hair cells (β-II-spectrin is absent; see also Supplementary Fig. 5) and the support cells in all neuromasts show coordinated orientation (one-way chi-square test p-value in o = 4.98 × 10⁻²⁰, p = 2.63 × 10⁻¹⁹). q, r MZwnt11 (wnt11f1) injected with atoh1a CRISPR show coordinated support cell orientation in primI-derived neuromasts (q p = 2.88 × 10−60) and do not show coordinated support cell orientation in primII neuromasts (r p = 0.24). Scale bar in a, c, and o equal 5 μm EXPRESSION / LABELING:
PHENOTYPE:
|
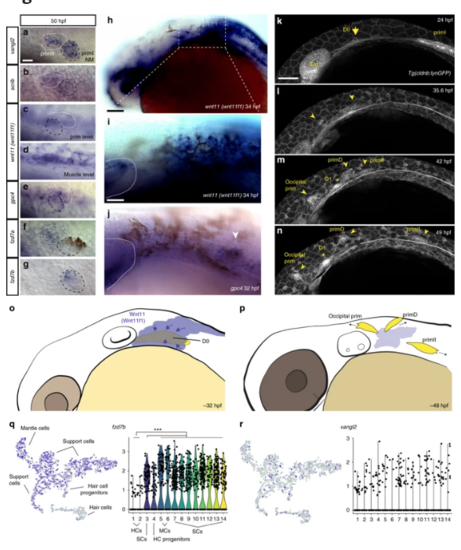
Temporal dynamic expression of the PCP and Wnt pathway genes during formation and migration of primII. a–g In situ localization on 50 hpf wild-type fish of mRNA for vangl2 (a), scrib (b), and wnt11 (wnt11f1) (c), at the level of the primordium; (d), at the level of the underlying muscle), gpc4 (e), fzd7a (f), fzd7b (g). The first neuromast derived from primI is outlined using black, while primII is outlined in white in (a–g). h In situ localization of wnt11 (wnt11f1) mRNA in a 34 hpf wild-type embryo. i Magnification of the expression in the area posterior to the ear in (h). The ear is delimited by a dashed line. j In situ localization of gpc4 mRNA in the area posterior to the ear at 32 hpf. Arrowhead indicates the putative localization of the D0 placode. k–n Still frames of the time lapse analysis of the formation of primII, primD, occipital prim, and D1 labeled in a Tg(cldnb:lynGFP) transgenic wild-type fish (Supplementary Video 5). Arrow in k indicates the original group of cells that gives rise to all three primordia. Arrowheads in l–n indicate the different primordia formed. Asterisk in m, n indicates the position of the D1 neuromast. o, p Schematic cartoon of the proposed mechanism by which Wnt11 (Wnt11f1) signals to cells in the D0 placode (o) to establish support cell organization (p). q t-SNE plots and violin plots showing expression of fzd7b (q) and vangl2 (r) in a 5 dpf neuromast during homeostasis. The Wilcox p-value for q = 8.45 × 10⁻³² in support cells and mantle cells versus hair cells, while in r the expression pattern was too sparse to generate meaningful statistics. HCs hair cells, SCs support cells, MCs mantle cells. *** denotes statistical significance. Scale bar in a equals 10 μm, h equals 50 μm, i equals 25 μm, k equals 50 μm |

The PCP and Wnt pathways act in parallel to establish coordinated hair cell polarity and orientation in the neuromast. Model of how the PCP signaling genes Vangl2 and Scrib are required to establish individual polarity in the hair cells (left part of the box), while the Wnt pathway members Wnt11 (Wnt11f1), Gpc4 and Fzd7a/7b interact to establish coordinated support cell alignment (right part of the box) in primII-derived neuromasts. The coordinated alignment of support cells, which we assume have normal polarity because coordinated alignment is not disrupted in PCP signaling mutants, then dictates the individual hair cell orientation |

wnt11 (wnt11/1) is expressed in the lateral line, interacts with gpc4 and does not act redundantly with wnt11/2 in setting up hair cell orientation. a. Priml-derived neuromasts are labeled with black arrowheads. White arrowheads indicate Primll-derived neuromasts that are outlined by using a dotted line. Priml-derived neuromasts show wnt11 (wnt11f1) mRNA expression on the anterior side but no signal is present in primll-derived neuromasts {see also Fig. 1d). b-n. Analysis of hair cell orientation with respect to the nearest neighbor. b. Diagram showing how the angle between two neighboring hair cells was calculated based on their relative positions to each other. For more details, see Methods. c-n. Histograms of angular data and fitted distribution (red) for each of the conditions analyzed. c-h. Binned angle distribution in priml-derived neuromasts. The von Mises distribution is shown in red to display the distribution of the data. c. Distribution in priml-derived neuromasts of wild type fish. Note the tight degree of alignment between neighbors (Uniform distribution p-value=7.7S x 10^-107). d-f. Distribution in priml-derived neuromasts of Wnt pathway mutants. They all show a high degree of alignment (Uniform distribution p-value in c= 1.21 x 10^-277, d= 1.97 x 10^-184 and e=S.46 x 10^-44). g. Angle distribution in priml-derived neuromasts of vang/2 mutants. Neighbor hair cells do not show angle coordination (Uniform distribution p-value= 0.212). h. Angle distribution in priml-derived neuromasts of MZscrib mutants. Hair cells show a high degree of coordination between neighbors (Uniform distribution p-value= 7.11 x 10^-86), but the distribution is more dispersed than the one shown by wild type fish. i-n. Binned angle distribution in primll- derived neuromasts. i. Angle distribution in primll-derived neuromasts of wild type fish. Note the high degree of alignment between neighbor hair cells (Uniform distribution p-value= 2.08 x 10^-106). j-l. Angle distribution in primll-derived neuromasts of Wnt pathway mutants. ln all three conditions, hair cells show significant degree of coordination between neighbors (Uniform distribution p-value in i= 3.09 x 10^-18, j= 1.97 x 10^-07, k= 7.03 x 10^-14). m. Angle distribution in primll-derived neuromasts of vang/2 mutants. Neighbor hair cells do not show coordination in their alignment (Uniform distribution p-value= 0.0S9). n. Angle distribution in primll- derived neuromasts of MZscrib mutants. Hair cells show a high degree of coordination between neighbors (Uniform distribution p-value= 1.09 x 10^-33), but the distribution is more dispersed than the one shown by wild type fish. o. Hair cell orientation is disrupted only in primll-derived neuromasts of 5dpf ( MZwnt11wnt11f1) homozygous siblings and MZwnt11 (wnt11f1);gpc4 double homozygous fish. Double MZwnt11 (wnt11f1);gpc4 mutants do not show a hair cell phenotype in priml neuromasts. p. Hair cell orientation in 5dpf wnt11f2 homozygous, wnt11 (wnt11f1) homozygous and double wnt11f2;wnt11 (wnt11f1) homozygous fish. Only a mutation in wnt11 (wnt11f1) disrupts hair cell orientation in primll-derived neuromasts. Thus, wnt11 (wnt11f1) and wnt11f2 do not act redundantly during the establishment of hair cell orientation. The cell axis defined by the position of the kinocilium is labeled in yellow. Scale bar in a equals 50µm, scale bar in o and p equals 5µm. PHENOTYPE:
|
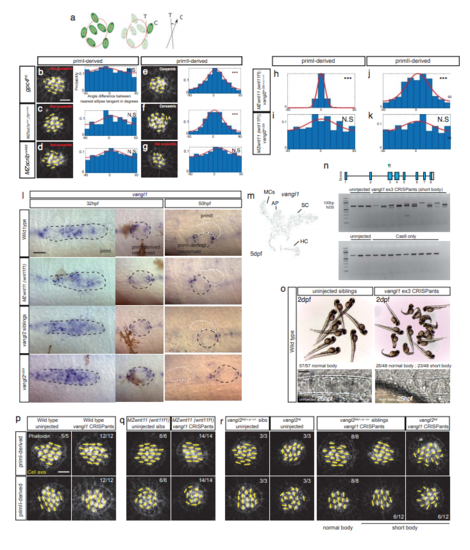
Wnt and PCP pathway mutants show different hair cell phenotypes, but not due to redundancy with vang/1. a. Diagram showing how the analysis of angle difference between a given hair cell’s orientation and the nearest fitting ellipse (concentricity) in each of the conditions was calculated. The angle between a cell’s axis (C) with respect to the tangent (T) of the nearest fitted ellipse is calculated for each cell. For more details, see Materials and Methods. b-d. Phalloidin images showing the cell polarity axis (yellow lines) in priml-derived neuromasts of gpc4 (b), MZfzd7a/7b (c) and MZscrib mutants (d). Based on the distribution of angles with respect to the nearest ellipse tangent {concentricity) none of the mutants shows significant concentricity (Uniform distribution p-values in b= 0.9S, c= 0.666, d=0.16S; gpc4 n=222 hair cells, MZfzd7a/7b n=74, MZscrib n=535). Additionally, the von Mises distribution is shown in red for visual display of the data distribution. e-g. Phalloidin images showing the cell polarity axis (yellow lines) in primll-derived neuromasts of gpc4 (e), MZfzd7a/7b (f) and MZscrib (g) mutants. Only the Wnt pathway mutants show significant concentricity (Uniform distribution p-values in e= 2.03 x 10^-11, f= 2.0S x 10^-12, g=0.488; gpc4 n=214 hair cells, MZfzd7a/7b n=182, MZscrib n=392). Yellow lines in b-g indicate the hair cell polarity axis, determined by the position of the kinocilium. Not Concentric vs Concentric labels were based on statistical significance. h-k. Analysis of hair cell orientation with respect to the nearest neighbor. h-i. Angle distribution in priml-derived neuromasts of single MZwnt11 (wnt11f1) siblings {h) and MZwnt11 (wnt11f1);vang/2 mutants (i). The high degree of alignment in h (Uniform distribution p-value= 1.82 x 10^-223) is lost in i (Uniform distribution p-value= 0.039S). j-k. Angle distribution in primll-derived neuromasts of single MZwnt11 (wnt11f1) siblings (j) and double MZwnt11 (wnt11f1);vang/2 mutants (k). Note how the high degree of alignment in j (Uniform distribution p-value= 1.29 x 10^-14) is lost in k (Uniform distribution p-value= 0.069). l. vang/1 in situ in wild type, MZwnt11 (wnt11f1) mutants and vang/2 siblings and mutants. No evident changes in expression were observed. m. scRNAseq t-SNE plot for vang/1 expression in a 5dpf wild type neuromast, where its expression is low in mantle cells (MCs). n. Agarose gels showing the efficiency of CRlSPR targeting of exon 3 in vang/1 in CRlSPants (upper part) and Cas9-only injections (lower part). o. Brightfield images of 2dpf wild type uninjected siblings (left) and vang/1 CRlSPants (right), which show shortened, curly tails. Bottom panels: DlC images of 25 hpf live embryos showing the morphology of the notochord cells that are stacked in uninjected fish and are rounded in vang/1 CRlSPants, a characteristic of PCP defects. p-r. Phalloidin staining of the hair cell orientation in uninjected and vang/1 CRlSPR injected wild type (p), MZwnt11 (wnt11f1) (q) and vang/2 mutants (r). vang/1 targeting by CRlSPR does not affect hair cell orientation in wild type fish or modifies the phenotype characteristic of MZwnt11 (wnt11f1) and vang/2 mutants. Scale bar in b and p equals 5µm; l and o equals 20µm. PHENOTYPE:
|

Vangl2 enrichment analysis in Wild type and the different Wnt and PCP pathway mutants. a. ln all the hair cells that show asymmetric Vangl2 in Figure 3i (green bar), we measured the pole of enrichment with respect to the position of the kinocilium. The results are categorized into three possibilities: asymmetric in the same pole as the kinocilium, asymmetric in the opposite pole than the kinocilium, and asymmetric but outside of the axis defined by the kinocilium. We observe differences between MZscrib and their siblings (Fisher’s exact test p-val WT priml vs MZscrib priml= 0.09724; p-val scrib siblings priml vs MZscrib priml= 0.0828S; p-val WT primll vs MZscrib primll= 0.02S68; p-val scrib siblings primll vs MZscrib primll= 0.03SS7). Wild type and MZwnt11 (wnt11f1) mutants do not show differences (p-val WT priml vs MZwnt11 (wnt11f1) priml= 1; p-val WT primll vs MZwnt11 (wnt11f1) primll= 0.439). b-e. Vangl2 antibody staining on vang/2 siblings priml (b) and primll (c). Vangl2 antibody staining is absent in priml (d) and primll (e) of vang/2 mutants. * denotes statistical significance. Scale bar equals 5µm. |
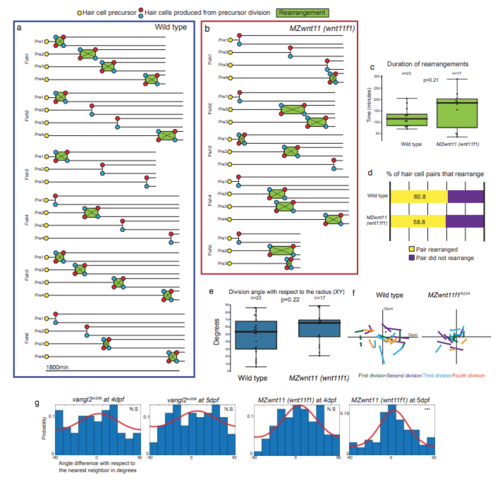
Comparison between the cell behaviors and hair cell phenotypes in the Wnt and PCP pathway mutants during development. a-f. Analyses of cell behaviors of hair cell precursors during development show no differences between Wild type and MZwnt11 (wnt11f1) mutants. a-b. Visual representation of the individual time lapses of hair cell formation in primll-derived neuromasts of Wild type (a) and MZwnt11 (wnt11f1) mutants (b). Each hair cell precursor (yellow) divides into two hair cells (red and blue) and either rearrange or not. c. Duration of the rearrangement that the hair cell progenitors undergo after division in wild type and MZwnt11 (wnt11f1) mutant embryos. d. Percentage of hair cell progenitors that undergo rearrangements after division in wild type and MZwnt11 (wnt11f1) mutant fish. e. Division angle with respect to the radius of each division event in hair cell progenitors of wild type and MZwnt11 (wnt11f1) mutant fish, and (f) the visual representation of each division event with respect to the XY axis. g. Histograms of angular data and von Mises fitted distribution (red) for the quantification of the alignment of each hair cell with respect to their closest neighbor during the development of primll-derived neuromasts in vang/2 and MZwnt11 (wnt11f1) mutant fish at 4 and 5dpf. Note how none of the conditions, except for MZwnt11 (wnt11f1) at 5dpf show coordination of the alignment of their hair cells with respect to their neighbor (Uniform distribution p-values for vang/2 at 4dpf=0.733, vang/2 at 5dpf=0.S12, MZwnt11 (wnt11f1) at 4dpf=0.066, MZwnt11 (wnt11f1) at 5dpf=1.46 x 10^-04). N.S = Not significant. *** p-value < 0.01. |
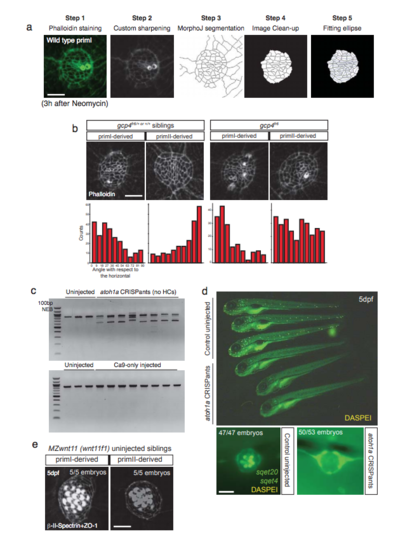
Pipeline for segmentation and analysis of support cell orientation, and description of the atoh1a CRISPR experiments. a. Pipeline for the segmentation of Phalloidin stainings of neuromasts 3 hours after hair cell ablation. Each Phalloidin image is sharpened and segmented. After segmentation, only the support cells are kept and used for fitting the Ellipse that determines the cell’s long axis. For further information, see Materials and Methods. b. Phalloidin staining of 5 dpf gpc4 sibling or mutants after removal of hair cells and quantification of support cell orientation with respect to the horizontal, showing support cell disorganization only in primll-derived neuromasts of gpc4 mutants (Uniform distribution p-val gpc4 siblings priml= 1.43 x 10^-12, gpc4 siblings primll= 1.30 x 10^-14; gpc4 mutants priml= 1.84 x 10^-14, gpc4 mutants primll= 0.80). c. Agarose gels showing the efficiency of CRlSPR targeting the single exon of atoh1a in CRlSPants (upper part) and Cas9-only injections (lower part). d. DASPEl staining of uninjected and atoh1a CRlSPR injected fish, showing that atoh1a CRlSPants do not possess hair cells. Below are shown higher magnification pictures of the neuromasts, where sqet20 labels the mantle cells and sqet4 and DASPEl label the hair cells. e. Double β-ll-Spectrin and ZO-1 labeling of the uninjected MZwnt11 (wnt11f1) siblings for Figure 5q, r. Scale bar in a, b and e equals 5 µm, d equals 20µm |
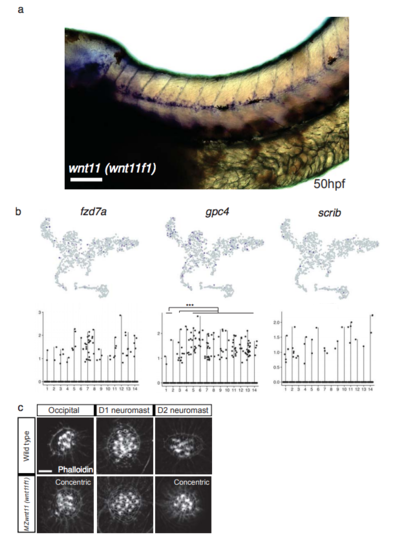
Expression of the different components of the Wnt and PCP pathways, and hair cell orientation in the Occipital and Dorsal lateral lines. a. Low magnification picture of wnt11 (wnt11f1) mRNA expression in the trunk of a 50hpf Wild type fish. wnt11 (wnt11f1) is expressed along the myoseptum. b. t-SNE plots and violin plots showing expression of fzd7a, gpc4 and scrib in a 5dpf homeostatic neuromast. The Wilcox p-value for gpc4 equals 6.4 x 10^-4 in support cells and mantle cells versus hair cells, while in fzd7a and scrib the expression pattern was too sparse to generate meaningful statistics. c. Hair cell orientation of neuromasts in the Occipital and Dorsal lateral lines of Wild type and MZwnt11 (wnt11f1) mutants. Neuromasts that show a hair cell phenotype in MZwnt11 (wnt11f1) mutants are labeled as concentric. D1=Dorsal 1. D2= Dorsal 2 (belonging to the dorsal lateral line). Scale bar in a equals 50µm; c equals 5µm. |
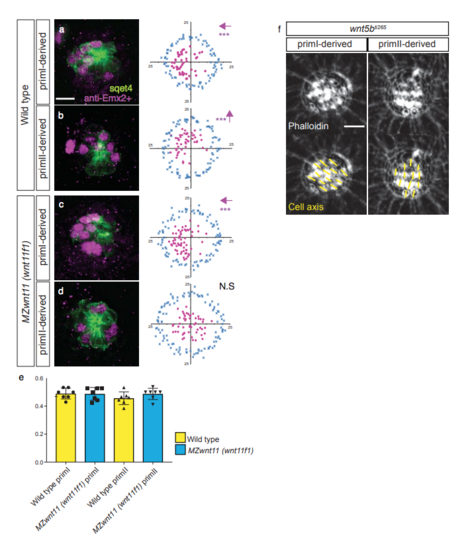
Emx2+ expression analysis and hair cell orientation in wntSb mutants. a-e. Distribution, but not ratio of expression, of Emx2+ hair cells is affected in primll-derived neuromasts of MZwnt11 (wnt11f1) mutants. Antibody staining for the transcription factor Emx2 in 5dpf Wild type (a- b) and MZwnt11 (MZwnt11f1) mutants (c-d). ln Wild type, Emx2+ hair cells are biased towards the anterior pole of the priml-derived neuromasts (a, Binomial test p=val 7.6 x 10^-06) and towards the dorsal pole in primll-derived neuromasts (b, p-val=7 x 10^-04). ln MZwnt11 (wnt11f1) mutants, the distribution is still biased in priml-derived neuromasts (c, p-val=8.S x 10^-10) but it is disrupted in primll-derived neuromasts (d, p-val=0.2). Additionally, in both wild type and MZwnt11 (wnt11f1) mutants, approximately half of the hair cells express Emx2 (e). f. Phalloidin staining of priml and primll-derived neuromast in a 5dpf wnt5bti265 mutant fish, showing no hair cell orientation defects. The arrows in a-c indicate the direction of bias in each case. *** denotes statistical significance for biased location. N.S= not significant. Error bars in e represent Standard Deviation. Scale bar in a equals 10µm, f equals 5µm. PHENOTYPE:
|