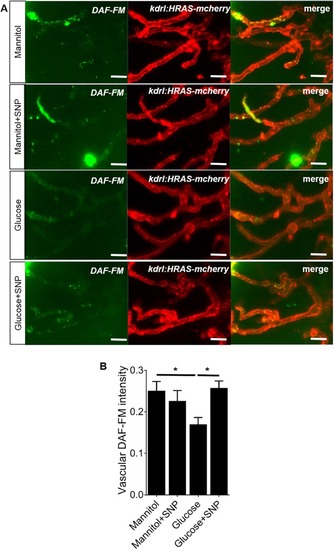
Effect of mannitol/glucose treatment with/withoutsodium nitroprusside(SNP) onnitric oxide(NO) reactivity, quantified by intensity of DAF-FM staining. (A) Representative micrographs of tectal vessels showing separate and merged channels (green: DAF-FM staining; red: kdrl:HRAS-mCherry) for 20 mM mannitol- or glucose-exposed larvae co-treated with or without SNP. Scale bars: 20 µm. (B) Quantification of DAF-FM intensity in the tectal vessels (n=25, 24, 27 and 24 larvae for mannitol, mannitol+SNP, glucose and glucose+SNP, respectively). Data are mean±s.e.m. *P<0.05.
Effect of mannitol/glucose treatment with/withoutsodium nitroprusside(SNP)onklf2a:GFP expression and number of mural cellson thetectal vessels. (A) Representative micrographs of tectal vessels in Tg(klf2a:GFP) exposed to 20 mM mannitol or glucose co-treated with or without SNP. Scale bars: 20 µm. (B) Quantification of klf2a:GFP intensity in the tectal vessels (n=26 larvae/group). (C) Representative micrographs of tectal vessels showing separate and merged channels (green: fli1:GFF:UAS:GCaMP6; red: sm222ab:nls-mCherry sh480) for 20 mM mannitol- or glucose-exposed larvae co-treated with or without SNP. Scale bars: 20 µm. Arrows indicate mural cell nuclei. (D) Quantification of the number of sm22ab:nls-mCherrysh480 nuclei on the tectal vessels for 20 mM mannitol- or glucose-exposed larvae co-treated with or without SNP (n=28 larvae/group). Data are mean±s.e.m. *P<0.05, **P<0.01.
Effect of mannitol/glucose treatment with/withoutsodium nitroprusside(SNP) onglial fibrillary acidic protein(GFAP) expression. (A) Representative micrographs showing the effect of mannitol/glucose exposure with or without SNP treatment on GFAP expression (red channel represents GFAP; blue channel represents DAPI). Scale bars: 20 µm. (B) Quantification of GFAP expression in the optic tectum (n=16, 12, 18 and 20 larvae for mannitol, mannitol+SNP, glucose and glucose+SNP, respectively). Data are mean±s.e.m. *P<0.05, ***P<0.001.
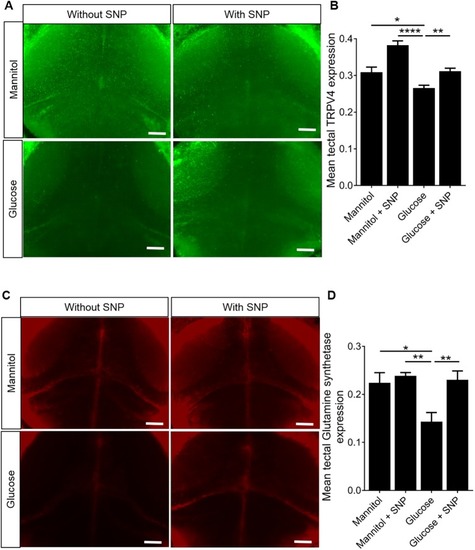
Effect of mannitol/glucose treatmentwith/withoutsodium nitroprusside(SNP) on TRPV4 and glutamine synthetase(GS). (A) Representative micrographs of optic tectum showing the effect of mannitol/glucose treatment with/without SNP treatment on the expression of TRPV4. Scale bars: 20 µm. (B) Quantification of the TRPV4 intensity in the optic tectum in a fixed volume of the tissue (n=21, 20, 24 and 26 larvae for mannitol, mannitol+SNP, glucose and glucose+SNP, respectively). (C) Representative micrographs of optic tectum showing the effect of mannitol/glucose treatment with/without SNP treatment on the expression of GS. Scale bars: 20 µm. (D) Quantification of the GS intensity in the optic tectum in a fixed volume of tissue (n=21, 20, 24 and 26 larvae for mannitol, mannitol+SNP, glucose and glucose+SNP, respectively). Data are mean±s.e.m. *P<0.05, **P<0.01, ****P<0.0001.
Effect of mannitol/glucose treatment with/withoutsodium nitroprusside(SNP) on larval zebrafish behaviour. (A) Representative trajectories of 9 dpf zebrafish moving in half-darkened wells (of a 12-well plate) as tracked by Viewpoint software for mannitol or glucose with or without SNP treatment. Red trajectories represent high speed (>6.4 mm/s), green low speed (3.3-6.3 mm/s), and black inactive (<3.3 mm/s). (B) Percentage of time spent in light region of the well by larvae (n=50, 45, 44 and 56 larvae for mannitol, mannitol+SNP, glucose and glucose+SNP, respectively). (C) Quantification of percentage time spent in low and high speed locomotion in the light region by the same animals as in B. (D) Quantification of percentage time spent in low and high speed locomotion in the dark region by the same animals as B and C. (E) Quantification of number of transitions into the light/dark regions for same larvae as in B-D. Data are mean±s.e.m. *P<0.05, **P<0.01 and ****P<0.0001.
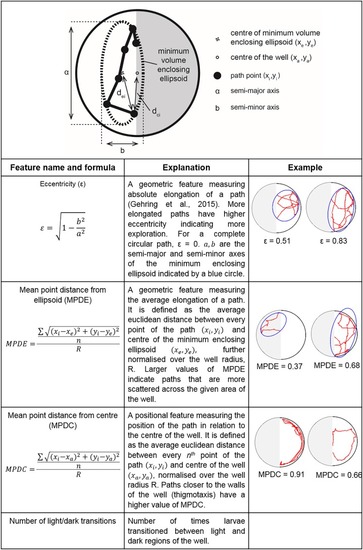
Mathematical description of features calculated from the larval trajectories. (Top) Schematic diagram of the well showing parameters calculated for various features. (Bottom) Table describing the formulae of calculated features for each coordinate of the trajectories. The minimum enclosing ellipsoid with centre (xe, ye) and major and minor axes of a and b is defined as the unique closed ellipse of smallest volume which enclose all points (xi, yi) of a path. is the Euclidean distance of every point of the path to centre of the well (xa, ya). is the distance between the centre of minimum enclosing ellipsoid (xe, ye) and ith point of the path. For each feature, two distinctive numeric examples are provided.
Acknowledgments
This image is the copyrighted work of the attributed author or publisher, and
ZFIN has permission only to display this image to its users.
Additional permissions should be obtained from the applicable author or publisher of the image.
Full text @ Dis. Model. Mech.
Your Input Welcome
Thank you for submitting comments. Your input has been emailed to ZFIN curators who may contact you if
additional information is required.
Oops. Something went wrong. Please try again later.