FIGURE SUMMARY
Title

β-glucan-dependent shuttling of conidia from neutrophils to macrophages occurs during fungal infection establishment

Authors
Pazhakh, V., Ellett, F., Croker, B.A., O'Donnell, J.A., Pase, L., Schulze, K.E., Greulich, R.S., Gupta, A., Reyes-Aldasoro, C.C., Andrianopoulos, A., Lieschke, G.J.
Source
Full text @ PLoS Biol.

Shuttling of individual <italic>T</italic>. <italic>marneffei</italic> conidia from neutrophil to macrophage.

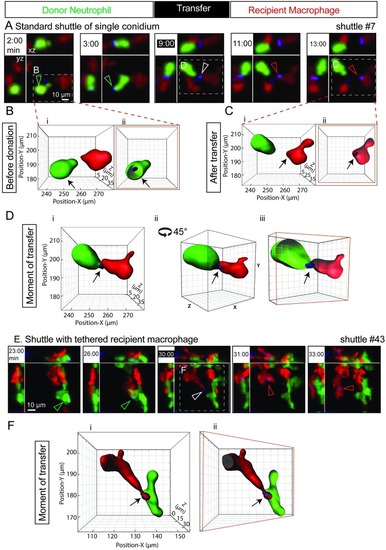
(A) A representative standard shuttle of a calcofluor-stained conidium (blue) from a Tg(mpx:EGFP) neutrophil (green) to a Tg(mpeg1:Gal4FF)×(UAS-E1b:Eco.NfsB-mCherry) macrophage (red), corresponding to the example in S1A Movie. Panels include isometric orthogonal yz and xz views corresponding to the xy maximal intensity projection and indicate the time in min from start of movie. The time point colored white-on-black is the moment of transfer. Colored arrowheads indicate the conidium within donor neutrophil (green), at the point of intercellular transfer (white) and in the recipient macrophage (red). (B–D) Volume-rendered views of the standard shuttle in (A), detailed before (B), at the moment of transfer (C), and afterwards (D), demonstrating the intracellular location of the shuttled spore in donor neutrophil and recipient macrophage, the focal intercellular contact at the moment of transfer. Cii is the image in Ci rotated 45° around a central vertical axis in the direction shown. Images Bii, Ciii, and Dii are sectioned volume-rendered views; a sectioned plane is represented by a red box. (E–F) Shuttle demonstrating tethering of the departing recipient macrophage following a shuttle. Panel E presentation organized as in panel A. The tethered moment of transfer is detailed by volume-rendering in F, presented as in panels B–D. Scales as shown. Stills in A and E correspond to S1A and S1B Movie, respectively. Eco.Nfsb, Escherichia coli nitroreductase; EGFP, enhanced green fluorescent protein; Gal4FF, engineered form of Saccharomyces cerevisiae Gal4 transcriptional activator; mpeg1, macrophage-expressed gene 1; mpx, myeloid-specific peroxidase; Tg, transgenic; UAS-E1b, upstream activating sequence fused to minimal adenovirus E1b promoter.

Variant shuttles of fungal conidia from neutrophil to macrophage.

A variety of shuttles of conidia (blue) from Tg(mpx:EGFP) neutrophils (green) to Tg(mpeg1:Gal4FF)×(UAS-E1b:Eco.NfsB-mCherry) macrophages (red). In each example, panels include isometric orthogonal yz and xz views corresponding to the xy maximal intensity projection and indicate the time in min from start of movie. Time points colored white-on-black are the moments of transfer. (A,C,E) include volume-rendered views corresponding to the maximal intensity projection; where this volume is sectioned (as in panel A), the framing box is shown in red. Colored arrowheads indicate the conidium within donor neutrophil (green), at the point of intercellular transfer (white), and in the recipient macrophage (red). (A–C) Shuttles of T. marneffei conidia. (A) Shuttle demonstrating tethering of the donor neutrophil at the moment of transfer. (B) Shuttle of multiple conidia from one donor neutrophil in quick succession. First two frames show donor neutrophil laden with multiple conidia at two preshuttle time points. Frames from t = 96:49–100:48 min are maximal intensity projections only, encompassing the shuttling transfer of 3 conidia over 4 min Upper row of panels shows red (macrophage) and blue (conidia) channels only; lower row of panels includes the green channel (donor neutrophil). (C) Shuttle of 2 conidia from one donor neutrophil one after the other at an interval of 2 min 13 s. Volume-rendered images corresponding to maximal intensity projections show the 2 shuttled conidia (labeled 1 and 2) before, during, and after the shuttle. (D–F) Shuttles of A. fumigatus conidia. (D) Standard shuttle of single conidium. (E) Standard shuttle of conidium labeled with Alexa Fluor 405 rather than calcofluor, accompanied by volume-rendered images that focus attention onto the conidium and donor neutrophil of interest. (F) Two independent shuttles by different donor neutrophils occurring in the same field. In this series, the course of each shuttled spore is followed by white and yellow arrowheads. Scales as shown. Stills in A–F correspond to S1C, S1E, S1F, S2A, S2C and S2E Movies, respectively. Eco.Nfsb, E. coli nitroreductase; EGFP, enhanced green fluorescent protein; Gal4FF, engineered form of S. cerevisiae Gal4 transcriptional activator; mpeg1, macrophage-expressed gene 1; mpx, myeloid-specific peroxidase; Tg, transgenic; UAS-E1b, upstream activating sequence fused to minimal adenovirus E1b promoter.

Shuttling of <italic>T</italic>. <italic>marneffei</italic> conidia between neutrophils and macrophages involves phagosome transfer.

(A) Shuttle of calcofluor-stained conidium (blue) from Tg(mpx:EGFP-CaaX) neutrophils (green) to Tg(mpeg1:mCherry-CaaX) macrophages (red). These reporter lines have membrane-localized fluorophore expression. Panels include isometric orthogonal yz and xz views corresponding to the xy maximal intensity projection and indicate the time in min from start of the movie. Colored arrowheads indicate a conidium before it is phagocytosed by the donor neutrophil (red), conidia within the donor neutrophil (yellow), and the conidium at the point of intercellular transfer and within the recipient macrophage (white). (Bi) Detail of the boxed area of the donor neutrophil in (A), 6-min panel. Yellow dotted line indicates the position of the cross-section for the 3-color fluorescence intensity plots in (ii) and (iii). Both shuttled and nonshuttled conidia are flanked by peaks of green fluorescence, consistent with their location in a membrane-lined phagosome. (C,D) Cross-sections fluorescence intensity profiles (ii) corresponding to the yellow lines in (i) for 2 macrophages that received a spore from a neutrophil in this dataset, which contained 3 independent spore shuttles. The arrowed EGFP-channel signal demonstrates the transfer of neutrophil-derived EGFP-tagged membrane in the vicinity of the spore (blue channel signal). Scales as shown. Stills in A correspond to S3A Movie. EGFP, enhanced green fluorescent protein; mpeg1, macrophage-expressed gene 1; mpx, myeloid-specific peroxidase; Tg, transgenic.

β-glucan is a fungal determinant sufficient to trigger shuttling.

(A,B) Relative frequency of shuttles for different cargos, incidence computed for each condition as number of 3-h imaging datasets with shuttle(s)/total number of imaging datasets. By chi-squared analysis, there are no significant differences for the comparisons: live spores of the two species (p = 0.38), live and dead T. marneffei (p = 0.31), and dead spores of the two species (p = 0.34). n-values indicate the number of datasets in each category. (C,D) Images of representative shuttles of zymosan particle (C) and β-glucan–coated plastic beads (D). Shuttles of particles (blue) are from Tg(mpx:EGFP) neutrophils (green) to Tg(mpeg1:Gal4FF)×(UAS-E1b:Eco.NfsB-mCherry) macrophages (red). In each example, panels include isometric orthogonal yz and xz views corresponding to the xy maximal intensity projection and indicate the time in min from start of movie. Colored arrowheads indicate the conidium within donor neutrophil (green), at the point of intercellular transfer (white) and in the recipient macrophage (red). Scales as shown. Stills in C, D correspond to S5A and S5C Movie, respectively. Datasets for A–B are provided in S1 Data. Eco.Nfsb, E. coli nitroreductase; EGFP, enhanced green fluorescent protein; Gal4FF, engineered form of S. cerevisiae Gal4 transcriptional activator; mpeg1, macrophage-expressed gene 1; mpx, myeloid-specific peroxidase; Tg, transgenic; UAS-E1b, upstream activating sequence fused to minimal adenovirus E1b promoter.

Zymosan shuttles by murine neutrophils and macrophages.

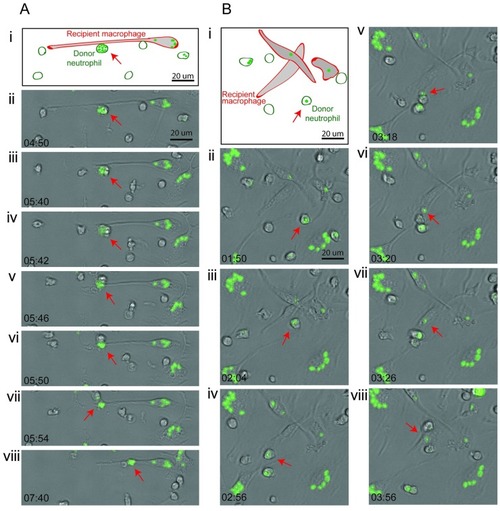
(A,B) Two sequences demonstrating neutrophil-to-macrophage shuttling of Alexa-Fluor-488–labeled zymosan particle between murine phagocytes in vitro. Panel (i) is a schematic showing the elongated, adherent recipient macrophage. Panels (ii–viii) are bright-field photomicrographs with green fluorescence channel overlaid, with time points indicated in min:s. Red arrow indicates the shuttled particle in donor neutrophil (panels ii–vi) and then, following shuttling, within the recipient macrophage (panels vii–viii). Stills from S6 Movie.

Shuttling of pHrodo-labeled zymosan particles between murine phagocytes in vitro.

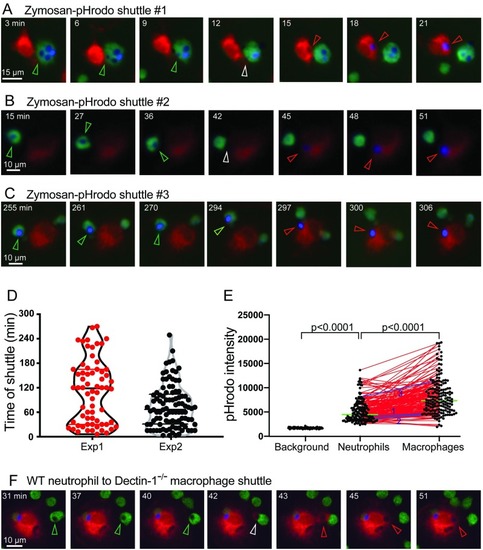
(A–C) Three examples of in vitro shuttling of zymosan–pHrodo particles, representative of 164 shuttling events. Neutrophils, green; macrophages, red; pHrodo–zymosan, false-colored blue. Scales as shown. Stills from S6C–S6E Movie. (D) Distribution of the time of shuttling for 164 in vitro shuttling events in panel C and S2 Table (Experiment 1, n = 66; Experiment 2, n = 98). (E) pHrodo signal intensity (arbitrary units) for in vitro shuttled zymosan–pHrodo particles (n = 164). Background intensity is for n = 100 randomly selected points clearly positioned between cells (n = 50 from each experiment). Black dots show the distributions of zymosan–pHrodo intensities in neutrophils 6 min before shuttling and in macrophages 6 min after shuttling; red lines connect paired values. p-values from unpaired two-tailed t test (background versus neutrophil) and paired two-tailed t test (neutrophil versus macrophage). Green line indicates median. Blue lines (1–3) correspond to the 3 examples shown in panels A–C. (F) Example of in vitro shuttling of a zymosan–pHrodo particle from a wild-type donor neutrophil to a Dectin-1−/− recipient macrophage. Scale as shown. Stills from S6F Movie. Colored arrowheads (in A–C and D) indicate the conidium within donor neutrophil (green), at the point of intercellular transfer (white), and in the recipient macrophage (red). Datasets for D–E are provided in S1 Data. Exp, experiment; WT, wild type.

Acknowledgments
This image is the copyrighted work of the attributed author or publisher, and ZFIN has permission only to display this image to its users. Additional permissions should be obtained from the applicable author or publisher of the image. Full text @ PLoS Biol.